
UNITED STATES
SECURITIES AND EXCHANGE COMMISSION
Washington, D.C. 20549
__________________________________
FORM 8-K
__________________________________
CURRENT REPORT
Pursuant to Section 13 or 15(d)
of The Securities Exchange Act of 1934
Date of Report (Date of earliest event reported): November 5, 2026
(Exact name of registrant as specified in its charter)
(State or other jurisdiction of incorporation) | (Commission File Number) | (I.R.S. Employer Identification No.) | ||||||
(Address of principal executive offices) | (Zip Code) | |||||||
(480 ) 618-6760
(Registrant’s telephone number, including area code)
N/A
(Former name or former address, if changed since last report)
Check the appropriate box below if the Form 8-K filing is intended to simultaneously satisfy the filing obligation of the registrant under any of the following provisions:
| Written communications pursuant to Rule 425 under the Securities Act (17 CFR 230.425) | |||||
| Soliciting material pursuant to Rule 14a-12 under the Exchange Act (17 CFR 240.14a-12) | |||||
| Pre-commencement communications pursuant to Rule 14d-2(b) under the Exchange Act (17 CFR 240.14d-2(b)) | |||||
| Pre-commencement communications pursuant to Rule 13e-4(c) under the Exchange Act (17 CFR 240.13e-4(c)) | |||||
Securities registered pursuant to Section 12(b) of the Act:
| Title of each class | Trading Symbol(s) | Name of each exchange on which registered | ||||||||||||
Indicate by check mark whether the registrant is an emerging growth company as defined in Rule 405 of the Securities Act of 1933 (§230.405 of this chapter) or Rule 12b-2 of the Securities Exchange Act of 1934 (§240.12b-2 of this chapter).
Emerging growth company ☐
If an emerging growth company, indicate by check mark if the registrant has elected not to use the extended transition period for complying with any new or revised financial accounting standards provided pursuant to Section 13(a) of the Exchange Act. o
Item 2.02Results of Operations and Financial Condition
On November 5, 2026, Opendoor Technologies Inc. (the “Company”) issued a press release announcing its financial results for the third quarter ended September 30, 2026. A copy of the press release is furnished as Exhibit 99.1 to this Current Report on Form 8-K.
Item 7.01 Regulation FD Disclosure
On November 5, 2026, the Company posted an earnings supplement (the “Supplement”) and supplemental macroeconomic charts (the “Supplemental Macro Charts”) in the “Investor Relations” portion of its website at investor.opendoor.com. A copy of the Supplement and the Supplemental Macro Charts is attached to this Current Report on Form 8-K as Exhibit 99.2 and 99.3, respectively.
The information contained in Items 2.02 and 7.01 of this Current Report (including Exhibits 99.1, 99.2, and 99.3 attached hereto) shall not be deemed “filed” for purposes of Section 18 of the Securities Exchange Act of 1934, as amended (the “Exchange Act”), or otherwise subject to the liabilities of that section, nor shall it be deemed incorporated by reference in any filing under the Securities Act of 1933, as amended, or the Exchange Act, except as shall be expressly set forth by specific reference in such a filing.
Item 9.01Financial Statements and Exhibits
(d)Exhibits.
| Exhibit No. | Description | |||||||
99.1 | ||||||||
| 99.2 | ||||||||
| 99.3 | ||||||||
| 104 | Cover Page Interactive Data File (Cover page XBRL tags are embedded within the Inline XBRL document) | |||||||
2
SIGNATURES
Pursuant to the requirements of the Securities Exchange Act of 1934, the registrant has duly caused this report to be signed on its behalf by the undersigned hereunto duly authorized.
| Opendoor Technologies Inc. | ||||||||
Date: November 5, 2026 | By: | /s/ Christy Schwartz | ||||||
| Name: | Christy Schwartz | |||||||
| Title: | Chief Financial Officer | |||||||
3
Exhibit 99.1
Opendoor Reports Third Quarter 2026 Financial Results
Revenue increased 12% year-over-year; homes purchased more than quadrupled; TTM marketing efficiency improved 57% and operations efficiency improved 36%.
SAN FRANCISCO, California - November 5, 2026 - Opendoor Technologies Inc. (Nasdaq: OPEN), a leading e-commerce platform for residential real estate transactions, today reported financial results for the quarter ended September 30, 2026.
Selected Highlights:
◦Revenue of $1,022 million, compared with $915 million in Q3 2025 and $883 million in Q2 2026, up 12% year-over-year and 16% quarter-over-quarter.
◦Homes purchased increased to 4,865 from 1,169 in Q3 2025, up 316%.
◦Signed acquisition volume represented an estimated 0.56% of market share in our addressable U.S. market in Q3 2026, compared with estimated 0.13% in Q3 2025 - roughly 4.4 times the prior-year level.
◦Homes listed for more than 120 days represented 18% of listed inventory at September 30, 2026, compared with 51% a year earlier and 30% for the overall market.
◦For the twelve months ended September 30, 2026, marketing expense per acquired home decreased to $2.8 thousand from $6.5 thousand in the prior-year period, down 57%.
◦For the twelve months ended September 30, 2026, operations expense per acquired home decreased to $4.0 thousand from $6.3 thousand in the prior-year period, down 36%.
◦Mortgage originations increased over 400% quarter-over-quarter.
“It’s been one year since we embarked on Opendoor 2.0 and I’m more confident in this company today than I was a year ago. We’re building a stronger, more capable company for the long term,” said Kaz Nejatian, CEO of Opendoor.
“A year ago, conventional wisdom was that Opendoor couldn’t grow without overpaying, couldn’t operate more efficiently and couldn’t use less capital per acquisition. Our progress tells a different story.”
“We’re earning more sellers’ business. Broader product choices, less friction and better customer education give homeowners more reasons to choose Opendoor. We’re seeing dramatically higher true seller conversion at comparable spreads than we have in years. We more than quadrupled homes purchased year-over-year, and Cash Now, More Later, which requires less capital upfront per home, accounted for more acquisitions than all products combined in Q3 2025.”
“We are handling that growth more efficiently. We’re automating more of the work, bringing more of the transaction together and making improvements to shared systems that carry across the business. On a trailing-twelve-month basis, marketing expense per acquired home fell 57%, and operations expense per acquired home fell 36%. We’re changing how the business operates.”
“We’re bringing that same focus to resale, giving buyers more reasons to choose an Opendoor home through easier shopping, greater home appeal and more affordable financing. We’re seeing early traction, with mortgage originations growing more than 400% quarter-over-quarter.”
“We’ve shown what focused execution can do for our seller funnel and our efficiency. We’re betting on ourselves to deliver the same change in resale.”
Our three management objectives remain the same. The table below shows our progress. Trailing 12- month cost comparisons cover the twelve months ended September 30, 2026 and 2025.
Management Objective | How We’ll Win | Progress and Accountability | ||||||
| (1) Scale Acquisitions | Broaden product suite Reduce friction Earn trust | - Homes purchased increased to 4,865 from 1,169 in Q3 2025. - Cash Now, More Later requires less capital upfront per home and accounted for more home purchases in Q3 2026 than all products combined in Q3 2025. - Estimated signed-acquisition market share increased to 0.56% in Q3 2026 from 0.13% in Q3 2025 - 4.4 times the prior-year level, measured against home-selling activity in our addressable U.S. market. | ||||||
| (2) Improve Unit Economics and Resale Velocity | Easier shopping Greater home appeal More affordable | - % of listed homes on the market for more than 120 days increased from 9% to 18% quarter-over-quarter, compared with 51% a year earlier and 30% for the overall market. - Mortgage originations increased over 400% QoQ. | ||||||
| (3) Build Operating Leverage1 | Automated intelligence Connected workflows Shared platform | - Trailing 12-month operations expense per acquired home declined 36% to $4.0 thousand from $6.3 thousand a year earlier. - Trailing 12-month marketing expense per acquired home declined 57% to $2.8 thousand from $6.5 thousand a year earlier. - Fixed operating expenses were $37 million compared with $35 million in Q2 2026. | ||||||
1 See Segment Information note within our most recent Annual Report on Form 10-K for the year ended December 31, 2025 and our Quarterly Reports on Form 10-Q for the quarters ended March 31, 2026 and June 30, 2026, and September 30, 2025.
Third Quarter 2026 Key Highlights
Three Months Ended | ||||||||||||||||||||
(In millions, except percentages and non-dollar amounts) | September 30, 2026 | September 30, 2025 | Change | |||||||||||||||||
| Revenue | $ | 1,022 | $ | 915 | $ | 107 | ||||||||||||||
Gross profit | $ | 38 | $ | 66 | $ | (28) | ||||||||||||||
| Gross Margin | 3.7 | % | 7.2 | % | ||||||||||||||||
Net loss | $ | (218) | $ | (90) | $ | (128) | ||||||||||||||
| Homes sold | 2,728 | 2,568 | 160 | |||||||||||||||||
| Homes purchased | 4,865 | 1,169 | 3,696 | |||||||||||||||||
| Homes in inventory (at period end) | 7,596 | 3,139 | 4,457 | |||||||||||||||||
| Inventory (at period end) | $ | 2,568 | $ | 1,053 | $ | 1,515 | ||||||||||||||
Homes under contract to purchase (at period end) | 1,780 | 526 | ||||||||||||||||||
Non-GAAP Financial Highlights (1) | ||||||||||||||||||||
Contribution Profit | $ | 34 | $ | 20 | $ | 14 | ||||||||||||||
| Contribution Margin | 3.3 | % | 2.2 | % | ||||||||||||||||
| Adjusted EBITDA | $ | (31) | $ | (33) | $ | 2 | ||||||||||||||
| Adjusted EBITDA Margin | (3.0) | % | (3.6) | % | ||||||||||||||||
| Adjusted Net Loss | $ | (66) | $ | (61) | $ | (5) | ||||||||||||||
(1) See “—Use of Non-GAAP Financial Measures” for further details and a reconciliation of such non-GAAP measures to their nearest comparable GAAP measures.
Guide Posts
We are driving to Adjusted Net Income positive by the end of 2026, measured on a twelve-month go-forward basis. We are currently behind but we intend to catch up.
Disciplined acquisition growth and operating efficiency reinforce our confidence in building a profitable business, but a slower market has put us behind our goal.
The following Q4 guideposts reflect current housing-market conditions and our existing inventory. Resale demand, pricing and the pace at which homes go under contract can change quickly, as they have in the last few months.
•Q4 2026 Outlook:
◦Acquisitions: You can track our acquisition contracts on accountable.opendoor.com2.
◦Revenue: We expect revenue to grow at least 40% year-over-year. You can track our resale closes on accountable.opendoor.com2.
2 The estimates and information presented at accountable.opendoor.com rely on assumptions and are subject to limitations; accordingly, no guarantee is made as to their accuracy. Acquisition contract volume represents contracts under which Opendoor has agreed to acquire a property, including through its Cash Now, More Later program, and does not reflect contracts that are subsequently cancelled.
◦Contribution Margin3: We expect Contribution Profit dollars to decline sequentially as we continue selling into a difficult market. Our focus is moving homes.
◦Adjusted EBITDA3: We expect an Adjusted EBITDA loss of $70 million to $85 million.
◦Stock-Based Compensation: We expect approximately $90 million.
You can continue to follow our progress on home acquisition contracts and product and feature launches every single week at accountable.opendoor.com.
Conference Call and Webcast Details
Opendoor will host a webcast to discuss its financial results on November 5, 2026, at 2:00 p.m. Pacific Time. A live webcast of the call can be accessed from Opendoor’s Investor Relations website at https://investor.opendoor.com. An archived version of the webcast will be available from the same website after the call.
About Opendoor
Opendoor’s mission is to tilt the world in favor of homeowners, by making homeownership simpler, faster, and fairer for everyone. Since 2014, the Company has provided people across the U.S. with a simpler, more certain way to sell and buy a home. Opendoor currently operates in markets nationwide. For more information, please visit www.opendoor.com.
Opendoor investors and others should note that we have used, and intend to continue to use, our website (including accountable.opendoor.com and investor.opendoor.com), press releases, Securities and Exchange Commission (“SEC”) filings, blogs, community hub and social media accounts, as well as the X (formerly known as Twitter) accounts of its Chief Executive Officer, @Nejatian, and @Opendoor, as means of disclosing material non-public information and for complying with its disclosure obligations under Regulation FD. Opendoor encourages investors and others to review the information Opendoor makes public in the foregoing locations as such information could be deemed to be material information. Please note that this list may be updated from time to time. Investors should subscribe to these social media accounts and Opendoor’s investor alerts, in addition to following its press releases, SEC filings, public conference calls and webcasts.
Forward Looking Statements
This press release contains certain forward-looking statements within the meaning of Section 27A the Private Securities Litigation Reform Act of 1995, as amended. All statements contained in this press release that do not relate to matters of historical fact should be considered forward-looking, including statements regarding our fiscal 2026 and fourth quarter of 2026 financial outlook; whether we are able to operate a level consistent with positive adjusted EBITDA or positive Adjusted Net Income going forward; scaling acquisitions, improving unit economics and resale velocity, and building operating leverage; transitioning to direct-to-consumer relationships and expanding our product suite; our future product offerings, including mortgage products and our ability to leverage AI to drive operational efficiency; the
3 Opendoor has not provided a quantitative reconciliation of forecasted Contribution Profit to forecasted Gross Profit, forecasted Contribution Margin to forecasted GAAP gross margin, nor a reconciliation of forecasted Adjusted EBITDA to forecasted GAAP net income (loss) within this press release because the Company is unable, without making unreasonable efforts, to calculate certain reconciling items with confidence. These items include, but are not limited to, inventory valuation adjustment and equity securities fair value adjustment. These items, which could materially affect the computation of forward-looking GAAP gross profit (loss), GAAP gross margin, and net income (loss), are inherently uncertain and depend on various factors, some of which are outside of the Company’s control. For more information regarding the non-GAAP financial measures discussed in this press release, please see “Use of Non-GAAP Financial Measures” following the financial tables below.
future health and status of our financial condition; and our business strategy and plans, including plans to continue to invest in and enhance our products. These forward-looking statements generally are identified by the words “anticipate”, “believe”, “contemplate”, “continue”, “could”, “estimate”, “expect”, “forecast”, “future”, “guidance”, “intend”, “may”, “might”, “opportunity”, “outlook”, “plan”, “possible”, “potential”, “predict”, “project”, “should”, “strategy”, “strive”, “target”, “vision”, “will”, or “would”, any negative of these words or other similar terms or expressions. The absence of these words does not mean that a statement is not forward-looking. Forward-looking statements are predictions, projections and other statements about future events that are based on current expectations and assumptions and, as a result, are subject to risks and uncertainties that can cause actual results to differ materially from those in such forward-looking statements. The factors that could cause or contribute to actual future events to differ materially from the forward-looking statements in this press release include but are not limited to: our ability to implement our strategy; the current and future health and stability of the economy, financial conditions and residential housing market, including any extended downturns or slowdowns; changes in general economic and financial conditions (including federal monetary policy, the imposition of tariffs and price or exchange controls, interest rates, inflation, actual or anticipated recession, home price fluctuations, and housing inventory), as well as the probability of such changes occurring, that impact demand for our products and services, lower our profitability or reduce our access to future financings; actual or anticipated fluctuations in our financial condition and results of operations; changes in projected operational and financial results; our real estate assets and increased competition in the U.S. residential real estate industry; our ability to operate and grow our core business products, including the ability to obtain sufficient financing and resell purchased homes; investment of resources to pursue strategies and develop new products and services that may not prove effective or that are not attractive to customers and/or partners or that do not allow us to compete successfully; our ability to acquire and resell homes profitably; our ability to grow market share; our ability to leverage AI to drive operational efficiency; our ability to manage our growth effectively; our ability to expeditiously sell and appropriately price our inventory; our ability to access sources of capital, including debt financing to finance our real estate inventories and other sources of capital to finance operations and growth; our ability to maintain liquidity and to raise the funds necessary for any cash settlement upon conversion of our outstanding convertible notes or upon repurchasing our outstanding convertible notes; development and performance of our mortgage products; any dilutive effect on our common stock upon any settlement of our outstanding convertible notes through the conversion of notes into shares of our common stock; our ability to maintain and enhance our products and brand, and to attract customers; our ability to manage, develop and refine our digital platform, including our automated pricing and valuation technology; our ability to realize expected benefits from our restructuring and cost reduction efforts; our ability to comply with multiple listing service rules and requirements to access and use listing data, and to maintain or establish relationships with listings and data providers; our ability to obtain or maintain licenses and permits to support our current and future business operations; acquisitions, strategic partnerships, joint ventures, capital-raising activities or other corporate transactions or commitments by us or our competitors; actual or anticipated changes in technology, products, markets or services by us or our competitors; our ability to protect our brand and intellectual property; our success in retaining or recruiting, or changes required in, our officers, key employees and/or directors; the impact of the regulatory environment and potential regulatory instability within our industry and complexities with compliance related to such environment; any future impact of pandemics, epidemics, or other public health crises on our ability to operate, demand for our products and services, or general economic conditions; our ability to maintain our listing on the Nasdaq Global Select Market; changes in laws or government regulation affecting our business; the impact of pending or future litigation or regulatory actions; and the volatility in the price of our common stock and warrants. The foregoing list of factors is not exhaustive. You should carefully consider the foregoing factors and the other risks and uncertainties described under the caption “Risk Factors” in our
most recent Annual Report on Form 10-K filed with the Securities and Exchange Commission (the “SEC”) on February 19, 2026, as updated by our periodic reports and other filings with the SEC. These filings identify and address other important risks and uncertainties that could cause actual events and results to differ materially from those contained in the forward-looking statements. Forward-looking statements speak only as of the date they are made. Readers are cautioned not to put undue reliance on forward-looking statements, and, except as required by law, we assume no obligation and do not intend to update or revise these forward-looking statements, whether as a result of new information, future events, or otherwise. We do not give any assurance that we will achieve our expectations.
Contact Information
Investors:
investors@opendoor.com
Media:
Contact Kaz on X @Nejatian
OPENDOOR TECHNOLOGIES INC.
FINANCIAL HIGHLIGHTS AND OPERATING METRICS
(In millions, except percentages, homes sold, homes purchased, and homes in inventory)
(Unaudited)
Three Months Ended | ||||||||||||||||||||||||||||||||
(In millions, except percentages and non-dollar amounts) | September 30, 2026 | June 30, 2026 | March 31, 2026 | December 31, 2025 | September 30, 2025 | |||||||||||||||||||||||||||
| Revenue | $ | 1,022 | $ | 883 | $ | 720 | $ | 736 | $ | 915 | ||||||||||||||||||||||
Gross profit | $ | 38 | $ | 86 | $ | 72 | $ | 57 | $ | 66 | ||||||||||||||||||||||
| Gross Margin | 3.7 | % | 9.7 | % | 10.0 | % | 7.7 | % | 7.2 | % | ||||||||||||||||||||||
Net loss | $ | (218) | $ | (162) | $ | (173) | $ | (1,096) | $ | (90) | ||||||||||||||||||||||
| Homes sold | 2,728 | 2,339 | 1,921 | 1,978 | 2,568 | |||||||||||||||||||||||||||
| Homes purchased | 4,865 | 4,378 | 2,474 | 1,706 | 1,169 | |||||||||||||||||||||||||||
| Homes in inventory (at period end) | 7,596 | 5,459 | 3,420 | 2,867 | 3,139 | |||||||||||||||||||||||||||
| Inventory (at period end) | $ | 2,568 | $ | 1,845 | $ | 1,139 | $ | 925 | $ | 1,053 | ||||||||||||||||||||||
Percentage of homes “on the market” for greater than 120 days (at period end) | 18 | % | 9 | % | 10 | % | 33 | % | 51 | % | ||||||||||||||||||||||
Non-GAAP Financial Highlights (1) | ||||||||||||||||||||||||||||||||
Contribution Profit | $ | 34 | $ | 51 | $ | 32 | $ | 7 | $ | 20 | ||||||||||||||||||||||
| Contribution Margin | 3.3 | % | 5.8 | % | 4.4 | % | 1.0 | % | 2.2 | % | ||||||||||||||||||||||
| Adjusted EBITDA | $ | (31) | $ | (4) | $ | (31) | $ | (43) | $ | (33) | ||||||||||||||||||||||
| Adjusted EBITDA Margin | (3.0) | % | (0.5) | % | (4.3) | % | (5.8) | % | (3.6) | % | ||||||||||||||||||||||
| Adjusted Net Loss | $ | (66) | $ | (30) | $ | (49) | $ | (62) | $ | (61) | ||||||||||||||||||||||
(1) See “—Use of Non-GAAP Financial Measures” for further details and a reconciliation of such non-GAAP measures to their nearest comparable GAAP measures.
OPENDOOR TECHNOLOGIES INC.
CONDENSED CONSOLIDATED STATEMENTS OF OPERATIONS
(In millions, except share amounts which are presented in thousands, and per share amounts)
(Unaudited)
| Three Months Ended | Nine Months Ended September 30, | ||||||||||||||||||||||||||||||||||||||||
| September 30, 2026 | June 30, 2026 | March 31, 2026 | December 31, 2025 | September 30, 2025 | 2026 | 2025 | |||||||||||||||||||||||||||||||||||
| REVENUE | $ | 1,022 | $ | 883 | $ | 720 | $ | 736 | $ | 915 | $ | 2,625 | $ | 3,635 | |||||||||||||||||||||||||||
| COST OF REVENUE | 984 | 797 | 648 | 679 | 849 | 2,429 | 3,342 | ||||||||||||||||||||||||||||||||||
| GROSS PROFIT | 38 | 86 | 72 | 57 | 66 | 196 | 293 | ||||||||||||||||||||||||||||||||||
| OPERATING EXPENSES: | |||||||||||||||||||||||||||||||||||||||||
| Sales, marketing and operations | 80 | 65 | 70 | 60 | 66 | 215 | 250 | ||||||||||||||||||||||||||||||||||
| General and administrative | 121 | 135 | 137 | 129 | 48 | 393 | 109 | ||||||||||||||||||||||||||||||||||
| Technology and development | 24 | 27 | 24 | 18 | 19 | 75 | 61 | ||||||||||||||||||||||||||||||||||
| Restructuring | — | 3 | — | — | 1 | 3 | 10 | ||||||||||||||||||||||||||||||||||
| Total operating expenses | 225 | 230 | 231 | 207 | 134 | 686 | 430 | ||||||||||||||||||||||||||||||||||
| LOSS FROM OPERATIONS | (187) | (144) | (159) | (150) | (68) | (490) | (137) | ||||||||||||||||||||||||||||||||||
| (LOSS) GAIN ON EXTINGUISHMENT OF DEBT | — | — | (1) | (933) | (1) | (1) | 9 | ||||||||||||||||||||||||||||||||||
| INTEREST EXPENSE | (38) | (29) | (23) | (28) | (34) | (90) | (103) | ||||||||||||||||||||||||||||||||||
| OTHER INCOME – Net | 8 | 11 | 10 | 14 | 14 | 29 | 28 | ||||||||||||||||||||||||||||||||||
LOSS BEFORE INCOME TAXES | (217) | (162) | (173) | (1,097) | (89) | (552) | (203) | ||||||||||||||||||||||||||||||||||
| INCOME TAX EXPENSE | (1) | — | — | 1 | (1) | (1) | (1) | ||||||||||||||||||||||||||||||||||
NET LOSS | $ | (218) | $ | (162) | $ | (173) | $ | (1,096) | $ | (90) | $ | (553) | $ | (204) | |||||||||||||||||||||||||||
Net loss per share attributable to common shareholders: | |||||||||||||||||||||||||||||||||||||||||
| Basic | $ | (0.23) | $ | (0.17) | $ | (0.18) | $ | (1.26) | $ | (0.12) | $ | (0.58) | $ | (0.28) | |||||||||||||||||||||||||||
| Diluted | $ | (0.23) | $ | (0.17) | $ | (0.18) | $ | (1.26) | $ | (0.12) | $ | (0.58) | $ | (0.28) | |||||||||||||||||||||||||||
| Weighted-average shares outstanding: | |||||||||||||||||||||||||||||||||||||||||
| Basic | 949,484 | 965,780 | 959,332 | 869,822 | 741,939 | 958,163 | 731,722 | ||||||||||||||||||||||||||||||||||
| Diluted | 949,484 | 965,780 | 959,332 | 869,822 | 741,939 | 958,163 | 731,722 | ||||||||||||||||||||||||||||||||||
OPENDOOR TECHNOLOGIES INC.
CONDENSED CONSOLIDATED BALANCE SHEETS
(In millions, except share data)
(Unaudited)
| September 30, 2026 | December 31, 2025 | |||||||||||||
| ASSETS | ||||||||||||||
| CURRENT ASSETS: | ||||||||||||||
| Cash and cash equivalents | $ | 910 | $ | 962 | ||||||||||
| Restricted cash | 98 | 339 | ||||||||||||
| Escrow receivable | 14 | 4 | ||||||||||||
| Real estate inventory, net | 2,568 | 925 | ||||||||||||
Other current assets ($1 and $0 carried at fair value) | 30 | 69 | ||||||||||||
| Total current assets | 3,620 | 2,299 | ||||||||||||
| PROPERTY AND EQUIPMENT – Net | 25 | 27 | ||||||||||||
| RIGHT OF USE ASSETS | 9 | 8 | ||||||||||||
| GOODWILL | 7 | 3 | ||||||||||||
| INTANGIBLES – Net | 5 | — | ||||||||||||
| OTHER ASSETS | 74 | 70 | ||||||||||||
| TOTAL ASSETS | $ | 3,740 | $ | 2,407 | ||||||||||
| LIABILITIES AND SHAREHOLDERS’ EQUITY | ||||||||||||||
| CURRENT LIABILITIES: | ||||||||||||||
| Accounts payable and other accrued liabilities | $ | 71 | $ | 80 | ||||||||||
| Asset-backed debt – current portion | 2,016 | 52 | ||||||||||||
Convertible senior notes – current portion | 59 | 193 | ||||||||||||
| Interest payable | 6 | 1 | ||||||||||||
| Lease liabilities – current portion | 2 | 1 | ||||||||||||
| Total current liabilities | 2,154 | 327 | ||||||||||||
| ASSET-BACKED DEBT – Net of current portion | 348 | 1,068 | ||||||||||||
| CONVERTIBLE SENIOR NOTES – Net of current portion | 639 | — | ||||||||||||
| LEASE LIABILITIES – Net of current portion | 6 | 6 | ||||||||||||
| OTHER LIABILITIES | 1 | 1 | ||||||||||||
| Total liabilities | 3,148 | 1,402 | ||||||||||||
| SHAREHOLDERS’ EQUITY: | ||||||||||||||
Common stock, $0.0001 par value; 3,000,000,000 shares authorized; 929,213,532 and 957,245,487 shares issued, respectively; 929,213,532 and 957,245,487 shares outstanding, respectively | — | — | ||||||||||||
| Additional paid-in capital | 6,179 | 6,038 | ||||||||||||
| Accumulated deficit | (5,586) | (5,033) | ||||||||||||
| Accumulated other comprehensive loss | (1) | — | ||||||||||||
| Total shareholders’ equity | 592 | 1,005 | ||||||||||||
| TOTAL LIABILITIES AND SHAREHOLDERS’ EQUITY | $ | 3,740 | $ | 2,407 | ||||||||||
OPENDOOR TECHNOLOGIES INC.
CONDENSED CONSOLIDATED STATEMENTS OF CASH FLOWS
(In millions)
(Unaudited)
| Nine Months Ended September 30, | |||||||||||
| 2026 | 2025 | ||||||||||
| CASH FLOWS FROM OPERATING ACTIVITIES: | |||||||||||
| Net loss | $ | (553) | $ | (204) | |||||||
| Adjustments to reconcile net loss to cash, cash equivalents, and restricted cash (used in) provided by operating activities: | |||||||||||
| Depreciation and amortization | 24 | 33 | |||||||||
| Amortization of right of use asset | 2 | 2 | |||||||||
| Stock-based compensation | 347 | 54 | |||||||||
| Inventory valuation adjustment | 76 | 48 | |||||||||
| Changes in fair value of equity securities | — | 3 | |||||||||
| Loss (gain) on early extinguishment of debt | 1 | (9) | |||||||||
| Other | 5 | 7 | |||||||||
| Origination of mortgage loans held for sale | (24) | — | |||||||||
| Proceeds from sale and principal collections of mortgage loans held for sale | 23 | — | |||||||||
| Changes in operating assets and liabilities: | |||||||||||
| Escrow receivable | (10) | (3) | |||||||||
| Real estate inventory | (1,703) | 1,054 | |||||||||
| Other assets | 38 | (15) | |||||||||
| Accounts payable and other accrued liabilities | (26) | 4 | |||||||||
| Interest payable | 5 | 6 | |||||||||
| Lease liabilities | (1) | (1) | |||||||||
| Net cash (used in) provided by operating activities | (1,796) | 979 | |||||||||
| CASH FLOWS FROM INVESTING ACTIVITIES: | |||||||||||
| Purchase of property and equipment | (13) | (9) | |||||||||
| Proceeds from sales, maturities, redemptions and paydowns of marketable securities | — | 6 | |||||||||
| Purchase of non-marketable equity securities | (5) | (6) | |||||||||
| Acquisitions, net of cash acquired | (10) | — | |||||||||
| Net cash used in investing activities | (28) | (9) | |||||||||
| CASH FLOWS FROM FINANCING ACTIVITIES: | |||||||||||
| Proceeds from issuance of convertible senior notes, net of discount | 650 | 75 | |||||||||
Repayment of convertible senior notes | (135) | — | |||||||||
Purchase of capped calls related to the convertible senior notes | (53) | — | |||||||||
Settlement of capped calls related to the convertible senior notes | — | 1 | |||||||||
| Proceeds from exercise of stock options | 1 | 4 | |||||||||
| Proceeds from issuance of common stock for ESPP | 1 | 2 | |||||||||
Proceeds from PIPE offering | — | 41 | |||||||||
Proceeds from the issuance of common stock under at-the-market offering, net | — | 198 | |||||||||
| Proceeds from asset-backed debt | 1,766 | 684 | |||||||||
| Principal payments on asset-backed debt | (526) | (1,268) | |||||||||
| Payment of loan origination fees and debt issuance costs | (12) | (16) | |||||||||
Repurchase and retirement of common stock | (161) | — | |||||||||
Other financing activities | — | (2) | |||||||||
| Net cash provided by (used in) financing activities | 1,531 | (281) | |||||||||
| NET (DECREASE) INCREASE IN CASH, CASH EQUIVALENTS, AND RESTRICTED CASH | (293) | 689 | |||||||||
| CASH, CASH EQUIVALENTS, AND RESTRICTED CASH – Beginning of period | 1,301 | 763 | |||||||||
| CASH, CASH EQUIVALENTS, AND RESTRICTED CASH – End of period | $ | 1,008 | $ | 1,452 | |||||||
| SUPPLEMENTAL DISCLOSURE OF CASH FLOW INFORMATION – Cash paid during the period for interest | $ | 80 | $ | 88 | |||||||
| DISCLOSURES OF NONCASH INVESTING AND FINANCING ACTIVITIES: | |||||||||||
| Stock-based compensation expense capitalized for internally developed software | $ | 6 | $ | 3 | |||||||
Principal value of 2026 Notes extinguished in Debt Exchange | $ | — | $ | (246) | |||||||
Principal value of 2030-A Notes issued in Debt Exchange | $ | — | $ | 246 | |||||||
| Investment in non-marketable equity securities of deconsolidated entities | $ | — | $ | 3 | |||||||
| RECONCILIATION TO CONDENSED CONSOLIDATED BALANCE SHEETS: | |||||||||||
| Cash and cash equivalents | $ | 910 | $ | 962 | |||||||
| Restricted cash | 98 | 490 | |||||||||
| Cash, cash equivalents, and restricted cash | $ | 1,008 | $ | 1,452 | |||||||
Use of Non-GAAP Financial Measures
To provide investors with additional information regarding the Company’s financial results, this press release includes references to certain non-GAAP financial measures that are used by management. The Company believes these non-GAAP financial measures including Adjusted Gross Profit, Contribution Profit, Adjusted Net Loss, Adjusted EBITDA, and any such non-GAAP financial measures expressed as a Margin, are useful to investors as supplemental operational measurements to evaluate the Company’s financial performance.
The non-GAAP financial measures should not be considered in isolation or as a substitute for the Company’s reported GAAP results because they may include or exclude certain items as compared to similar GAAP-based measures, and such measures may not be comparable to similarly-titled measures reported by other companies. Management uses these non-GAAP financial measures for financial and operational decision-making and as a means to evaluate period-to-period comparisons. Management believes that these non-GAAP financial measures provide meaningful supplemental information regarding the Company’s performance by excluding certain items that may not be indicative of the Company’s recurring operating results.
Adjusted Gross Profit and Contribution Profit
To provide investors with additional information regarding our margins and return on inventory acquired, we have included Adjusted Gross Profit and Contribution Profit, which are non-GAAP financial measures. We believe that Adjusted Gross Profit and Contribution Profit are useful financial measures for investors as they are supplemental measures used by management in evaluating unit level economics and our operating performance. Each of these measures is intended to present the economics related to homes sold during a given period. We do so by including revenue generated from homes sold (and adjacent services) in the period and only the expenses that are directly attributable to such home sales, even if such expenses were recognized in prior periods, and excluding expenses related to homes that remain in inventory as of the end of the period. Contribution Profit provides investors a measure to assess Opendoor’s ability to generate returns on homes sold during a reporting period after considering home purchase costs, renovation and repair costs, holding costs and selling costs.
Adjusted Gross Profit and Contribution Profit are supplemental measures of our operating performance and have limitations as analytical tools. For example, these measures include costs that were recorded in prior periods under GAAP and exclude, in connection with homes held in inventory at the end of the period, costs required to be recorded under GAAP in the same period. Accordingly, these measures should not be considered in isolation or as a substitute for analysis of our results as reported under GAAP. We include a reconciliation of these measures to the most directly comparable GAAP financial measure, which is gross profit.
Adjusted Gross Profit / Margin
We calculate Adjusted Gross Profit as gross profit under GAAP adjusted for (1) inventory valuation adjustment in the current period, and (2) inventory valuation adjustment in prior periods. Inventory valuation adjustment in the current period is calculated by adding back the inventory valuation adjustments recorded during the period on homes that remain in inventory at period end. Inventory valuation adjustment in prior periods is calculated by subtracting the inventory valuation adjustments recorded in prior periods on homes sold in the current period. Adjusted Gross Margin is Adjusted Gross Profit as a percentage of revenue.
We view this metric as an important measure of business performance as it captures gross margin performance isolated to homes sold in a given period and provides comparability across reporting periods. Adjusted Gross Profit helps management assess home pricing, service fees and renovation performance for a specific resale cohort.
Contribution Profit / Margin
We calculate Contribution Profit as Adjusted Gross Profit, minus certain costs incurred on homes sold during the current period including: (1) holding costs incurred in the current period, (2) holding costs incurred in prior periods, and (3) direct selling costs. Contribution Margin is Contribution Profit as a percentage of revenue. Contribution Profit per Home Sold is calculated by dividing Contribution Profit by the number of homes sold in the period.
We view these metrics as an important measure of business performance as it captures the unit level performance isolated to homes sold in a given period and provides comparability across reporting periods. Contribution Profit helps management assess the revenues and certain costs directly attributable to a specific resale cohort.
OPENDOOR TECHNOLOGIES INC.
RECONCILIATION OF GAAP TO NON-GAAP MEASURES
(In millions, except percentages, and homes sold)
(Unaudited)
The following table presents a reconciliation of our Adjusted Gross Profit and Contribution Profit to our gross profit, which is the most directly comparable GAAP measure, for the periods indicated:
| Three Months Ended | Nine Months Ended September 30, | |||||||||||||||||||||||||||||||||||||||||||
| (in millions, except percentages and homes sold, or as noted) | September 30, 2026 | June 30, 2026 | March 31, 2026 | December 31, 2025 | September 30, 2025 | 2026 | 2025 | |||||||||||||||||||||||||||||||||||||
| Revenue (GAAP) | $ | 1,022 | $ | 883 | $ | 720 | $ | 736 | $ | 915 | $ | 2,625 | $ | 3,635 | ||||||||||||||||||||||||||||||
Gross profit (GAAP) | $ | 38 | $ | 86 | $ | 72 | $ | 57 | $ | 66 | $ | 196 | $ | 293 | ||||||||||||||||||||||||||||||
| Gross Margin | 3.7 | % | 9.7 | % | 10.0 | % | 7.7 | % | 7.2 | % | 7.5 | % | 8.1 | % | ||||||||||||||||||||||||||||||
| Adjustments: | ||||||||||||||||||||||||||||||||||||||||||||
Inventory valuation adjustment – Current Period(1)(2) | 53 | 14 | 9 | 9 | 15 | 62 | 29 | |||||||||||||||||||||||||||||||||||||
Inventory valuation adjustment – Prior Periods(1)(3) | (11) | (9) | (14) | (21) | (17) | (20) | (23) | |||||||||||||||||||||||||||||||||||||
Adjusted Gross Profit | $ | 80 | $ | 91 | $ | 67 | $ | 45 | $ | 64 | $ | 238 | $ | 299 | ||||||||||||||||||||||||||||||
| Adjusted Gross Margin | 7.8 | % | 10.3 | % | 9.3 | % | 6.1 | % | 7.0 | % | 9.1 | % | 8.2 | % | ||||||||||||||||||||||||||||||
| Adjustments: | ||||||||||||||||||||||||||||||||||||||||||||
Direct selling costs(4) | (35) | (29) | (23) | (23) | (28) | (87) | (100) | |||||||||||||||||||||||||||||||||||||
Holding costs on sales – Current Period(5)(6) | (4) | (3) | (3) | (4) | (4) | (22) | (33) | |||||||||||||||||||||||||||||||||||||
Holding costs on sales – Prior Periods(5)(7) | (7) | (8) | (9) | (11) | (12) | (12) | (23) | |||||||||||||||||||||||||||||||||||||
Contribution Profit | $ | 34 | $ | 51 | $ | 32 | $ | 7 | $ | 20 | $ | 117 | $ | 143 | ||||||||||||||||||||||||||||||
| Homes sold in period | 2,728 | 2,339 | 1,921 | 1,978 | 2,568 | 6,988 | 9,813 | |||||||||||||||||||||||||||||||||||||
Contribution Profit per Home Sold (in thousands) | $ | 12 | $ | 22 | $ | 17 | $ | 4 | $ | 8 | $ | 17 | $ | 15 | ||||||||||||||||||||||||||||||
| Contribution Margin | 3.3 | % | 5.8 | % | 4.4 | % | 1.0 | % | 2.2 | % | 4.5 | % | 3.9 | % | ||||||||||||||||||||||||||||||
________________
(1)Inventory valuation adjustment includes adjustments to record real estate inventory at the lower of its carrying amount or its net realizable value.
(2)Inventory valuation adjustment — Current Period is the inventory valuation adjustments recorded during the period presented associated with homes that remain in inventory at period end.
(3)Inventory valuation adjustment — Prior Periods is the inventory valuation adjustments recorded in prior periods associated with homes that sold in the period presented.
(4)Represents selling costs incurred related to homes sold in the relevant period. This primarily includes broker commissions, external title and escrow-related fees and transfer taxes. Selling costs are included in Sales, marketing and operations on the condensed consolidated statements of operations.
(5)Holding costs primarily include property taxes, insurance, utilities, homeowners association dues and maintenance costs. Holding costs are included in Sales, marketing, and operations on the condensed consolidated statements of operations.
(6)Represents holding costs incurred in the period presented on homes sold in the period presented.
(7)Represents holding costs incurred in prior periods on homes sold in the period presented.
Adjusted Net Loss and Adjusted EBITDA
We also present Adjusted Net Loss and Adjusted EBITDA, which are non-GAAP financial measures that management uses to assess our underlying financial performance. These measures are also commonly used by investors and analysts to compare the underlying performance of companies in our industry. We believe these measures provide investors with meaningful period over period comparisons of our underlying performance, adjusted for certain charges that are non-cash, not directly related to our revenue-generating operations, not aligned to related revenue, or not reflective of ongoing operating results that vary in frequency and amount.
Adjusted Net Loss and Adjusted EBITDA are supplemental measures of our operating performance and have important limitations. For example, these measures exclude the impact of certain costs required to be recorded under GAAP. These measures also include inventory valuation adjustments that were recorded in prior periods under GAAP and exclude, in connection with homes held in inventory at the end of the period, inventory valuation adjustments required to be recorded under GAAP in the same period. These measures could differ substantially from similarly titled measures presented by other companies in our industry or companies in other industries. Accordingly, these measures should not be considered in isolation or as a substitute for analysis of our results as reported under GAAP. We include a reconciliation of these measures to the most directly comparable GAAP financial measure, which is net loss.
Adjusted Net Loss
We calculate Adjusted Net Loss as GAAP net loss adjusted to exclude non-cash expenses of stock-based compensation, equity securities fair value adjustment, intangibles amortization expense, and the amortization of stock-based compensation capitalized to internally developed software (“IDSW”). It excludes expenses that are not directly related to our revenue-generating operations such as restructuring and CEO make-whole provision. It also excludes loss (gain) on extinguishment of debt as these expenses or gains were incurred as a result of decisions made by management to terminate or partially extinguish portions of our outstanding credit facilities or convertible senior notes early; these expenses or gains are not reflective of ongoing operating results and vary in frequency and amount. Adjusted Net Loss also aligns the timing of inventory valuation adjustments recorded under GAAP to the period in which the related revenue is recorded in order to improve the comparability of this measure to our non-GAAP financial measures of unit economics, as described above. Our calculation of Adjusted Net Loss does not currently include the tax effects of the non-GAAP adjustments because our taxes and such tax effects have not been material to date.
Adjusted EBITDA / Margin
We calculate Adjusted EBITDA as Adjusted Net Loss adjusted for depreciation and amortization, property financing and other interest expense, interest income, and income tax expense. Adjusted EBITDA is a supplemental performance measure that our management uses to assess our operating performance and the operating leverage in our business. Adjusted EBITDA Margin is Adjusted EBITDA as a percentage of revenue.
The following table presents a reconciliation of our Adjusted Net Loss and Adjusted EBITDA to our net loss, which is the most directly comparable GAAP measure, for the periods indicated:
Three Months Ended | Nine Months Ended September 30, | |||||||||||||||||||||||||||||||||||||||||||
| (in millions, except percentages) | September 30, 2026 | June 30, 2026 | March 31, 2026 | December 31, 2025 | September 30, 2025 | 2026 | 2025 | |||||||||||||||||||||||||||||||||||||
| Revenue (GAAP) | $ | 1,022 | $ | 883 | $ | 720 | $ | 736 | $ | 915 | $ | 2,625 | $ | 3,635 | ||||||||||||||||||||||||||||||
| Net loss (GAAP) | $ | (218) | $ | (162) | $ | (173) | $ | (1,096) | $ | (90) | $ | (553) | $ | (204) | ||||||||||||||||||||||||||||||
| Adjustments: | ||||||||||||||||||||||||||||||||||||||||||||
| Stock-based compensation | 12 | 19 | 15 | 16 | 13 | 46 | 40 | |||||||||||||||||||||||||||||||||||||
| Stock-based compensation for market condition RSUs | 96 | 100 | 105 | 89 | 14 | 301 | 14 | |||||||||||||||||||||||||||||||||||||
| Amortization of stock-based compensation capitalized to IDSW | 2 | 3 | 3 | 3 | 4 | 8 | 11 | |||||||||||||||||||||||||||||||||||||
Equity securities fair value adjustment(1) | — | — | — | — | — | — | 3 | |||||||||||||||||||||||||||||||||||||
Intangibles amortization expense(2) | 1 | — | — | — | — | 1 | — | |||||||||||||||||||||||||||||||||||||
Inventory valuation adjustment – Current Period(3)(4) | 53 | 14 | 9 | 9 | 15 | 62 | 29 | |||||||||||||||||||||||||||||||||||||
Inventory valuation adjustment — Prior Periods(3)(5) | (11) | (9) | (14) | (21) | (17) | (20) | (23) | |||||||||||||||||||||||||||||||||||||
Restructuring(6) | — | 3 | — | — | 1 | 3 | 10 | |||||||||||||||||||||||||||||||||||||
CEO make-whole provision(7) | — | 4 | 5 | 5 | — | 9 | — | |||||||||||||||||||||||||||||||||||||
Loss (gain) on extinguishment of debt | — | — | 1 | 933 | 1 | 1 | (9) | |||||||||||||||||||||||||||||||||||||
Other(8) | (1) | (2) | — | — | (2) | (3) | (4) | |||||||||||||||||||||||||||||||||||||
Adjusted Net Loss | $ | (66) | $ | (30) | $ | (49) | $ | (62) | $ | (61) | $ | (145) | $ | (133) | ||||||||||||||||||||||||||||||
| Adjustments: | ||||||||||||||||||||||||||||||||||||||||||||
| Depreciation and amortization, excluding amortization of intangibles | 3 | 5 | 5 | 5 | 5 | 13 | 15 | |||||||||||||||||||||||||||||||||||||
Property financing(9) | 34 | 24 | 19 | 21 | 23 | 77 | 81 | |||||||||||||||||||||||||||||||||||||
Other interest expense(10) | 4 | 5 | 4 | 7 | 11 | 13 | 22 | |||||||||||||||||||||||||||||||||||||
Interest income(11) | (7) | (8) | (10) | (13) | (12) | (25) | (26) | |||||||||||||||||||||||||||||||||||||
| Income tax expense | 1 | — | — | (1) | 1 | 1 | 1 | |||||||||||||||||||||||||||||||||||||
| Adjusted EBITDA | $ | (31) | $ | (4) | $ | (31) | $ | (43) | $ | (33) | $ | (66) | $ | (40) | ||||||||||||||||||||||||||||||
| Adjusted EBITDA Margin | (3.0) | % | (0.5) | % | (4.3) | % | (5.8) | % | (3.6) | % | (2.5) | % | (1.1) | % | ||||||||||||||||||||||||||||||
________________
(1)Represents the gains and losses on certain financial instruments, which are marked to fair value at the end of each period.
(2)Represents amortization of acquisition-related intangible assets.
(3)Inventory valuation adjustment includes adjustments to record real estate inventory at the lower of its carrying amount or its net realizable value.
(4)Inventory valuation adjustment — Current Period is the inventory valuation adjustments recorded during the period presented associated with homes that remain in inventory at period end.
(5)Inventory valuation adjustment — Prior Periods is the inventory valuation adjustments recorded in prior periods associated with homes that sold in the period presented.
(6)Restructuring expense consists primarily of severance and other termination benefits for employees whose roles have been eliminated, consulting fees, and expenses related to the termination of certain leases incurred during the restructuring process.
(7)In connection with the appointment of the Company's new Chief Executive Officer in September 2025, the Company granted two make-whole awards related to compensation forfeited from his former employer. The awards consisted of (i) a $15 million cash award and (ii) a restricted stock unit award with a grant date value of $15 million. Both awards vested nine months after his start date and were expensed over the requisite service period. The CEO make-whole provision adjustment reflects only the expense associated with the cash make-whole award. The expense associated with the restricted stock unit make-whole award is included in the stock-based compensation line item presented separately in the reconciliation above.
(8)Primarily includes related party services income and sublease income.
(9)Includes interest expense on our asset-backed debt facilities.
(10)Includes (i) amortization of debt issuance costs, loan origination fees, commitment fees, unused fees, and other interest-related costs on our asset-backed debt facilities, and (ii) amortization of debt issuance costs and debt discounts and interest expense related to our convertible senior notes.
(11)Consists mainly of interest earned on cash, cash equivalents and restricted cash.
OPENDOOR TECHNOLOGIES INC.
SEGMENT INFORMATION
(In millions)
(Unaudited)
| Three Months Ended | ||||||||||||||||||||||||||||||||
| (in millions) | September 30, 2026 | June 30, 2026 | March 31, 2026 | December 31, 2025 | September 30, 2025 | |||||||||||||||||||||||||||
| Revenue | $ | 1,022 | $ | 883 | $ | 720 | $ | 736 | $ | 915 | ||||||||||||||||||||||
| Less: | ||||||||||||||||||||||||||||||||
| Cost of revenue | (984) | (797) | (648) | (679) | (849) | |||||||||||||||||||||||||||
Direct selling costs(1) | (35) | (29) | (23) | (23) | (28) | |||||||||||||||||||||||||||
Holding costs(2) | (11) | (11) | (12) | (15) | (16) | |||||||||||||||||||||||||||
Advertising and other marketing expense(3) | (5) | (5) | (19) | (9) | (7) | |||||||||||||||||||||||||||
Operations(4) | (15) | (14) | (12) | (13) | (12) | |||||||||||||||||||||||||||
Fixed operating expense(5) | (37) | (35) | (33) | (35) | (37) | |||||||||||||||||||||||||||
CEO make-whole provision(6) | — | (4) | (5) | (5) | — | |||||||||||||||||||||||||||
| Stock-based compensation | (12) | (19) | (15) | (16) | (13) | |||||||||||||||||||||||||||
| Stock-based compensation for market condition RSUs | (96) | (100) | (105) | (89) | (14) | |||||||||||||||||||||||||||
| Interest expense | (38) | (29) | (23) | (28) | (34) | |||||||||||||||||||||||||||
| Interest income | 7 | 8 | 10 | 13 | 12 | |||||||||||||||||||||||||||
Other(7) | (14) | (10) | (8) | (933) | (7) | |||||||||||||||||||||||||||
| Net loss | $ | (218) | $ | (162) | $ | (173) | $ | (1,096) | $ | (90) | ||||||||||||||||||||||
________________
(1)Represents selling costs incurred related to homes sold in the relevant period. This primarily includes broker commissions, external title and escrow-related fees and transfer taxes and are included in Sales, marketing and operations.
(2)Represents holding costs incurred both in the period presented and in prior periods on homes sold in the period presented (“Resale Cohort Holding Costs”). Holding costs include mainly property taxes, insurance, utilities, homeowners association dues, and maintenance costs. Holding costs are included in Sales, marketing and operations in the period in which they are incurred (“GAAP Holding Costs”).
(3)Advertising expenses are included in Sales, marketing and operations. Other marketing expenses include non-advertising marketing expenses such as acquisition leads and referrals and public relations services and are included in Sales, marketing and operations.
(4)Represents operating expenses that are generally related to the volume of homes transacted during the period and tend to be variable in nature. Primarily includes workforce expenses in support of sales, and real estate inventory operations.
(5)Represents operating expenses that are not directly correlated with home transaction volumes. These expenses generally include costs related to salaries and benefits for our leadership, finance, technology, human resources, legal, marketing and administrative personnel, as well as third-party professional services fees, rent expense and third-party software.
(6)In connection with the appointment of the Company's new Chief Executive Officer in September 2025, the Company granted two make-whole awards related to compensation forfeited from his former employer. The awards consisted of (i) a $15 million cash award and (ii) a restricted stock unit award with a grant date value of $15 million. Both awards vested nine months after his start date and were expensed over the requisite service period. The CEO make-whole provision adjustment reflects only the expense associated with the cash make-whole award. The expense associated with the restricted stock unit make-whole award is included in the stock-based compensation line item presented separately in the reconciliation above.
(7)Other segment income (expenses) are primarily made up of depreciation and amortization, gain on deconsolidation, net, restructuring, and amortization of stock-based compensation capitalized to internally developed software. This also includes the elimination of holding costs incurred in prior periods on homes sold in the periods presented, and includes holding costs incurred in the current period on homes remaining in inventory at period end.
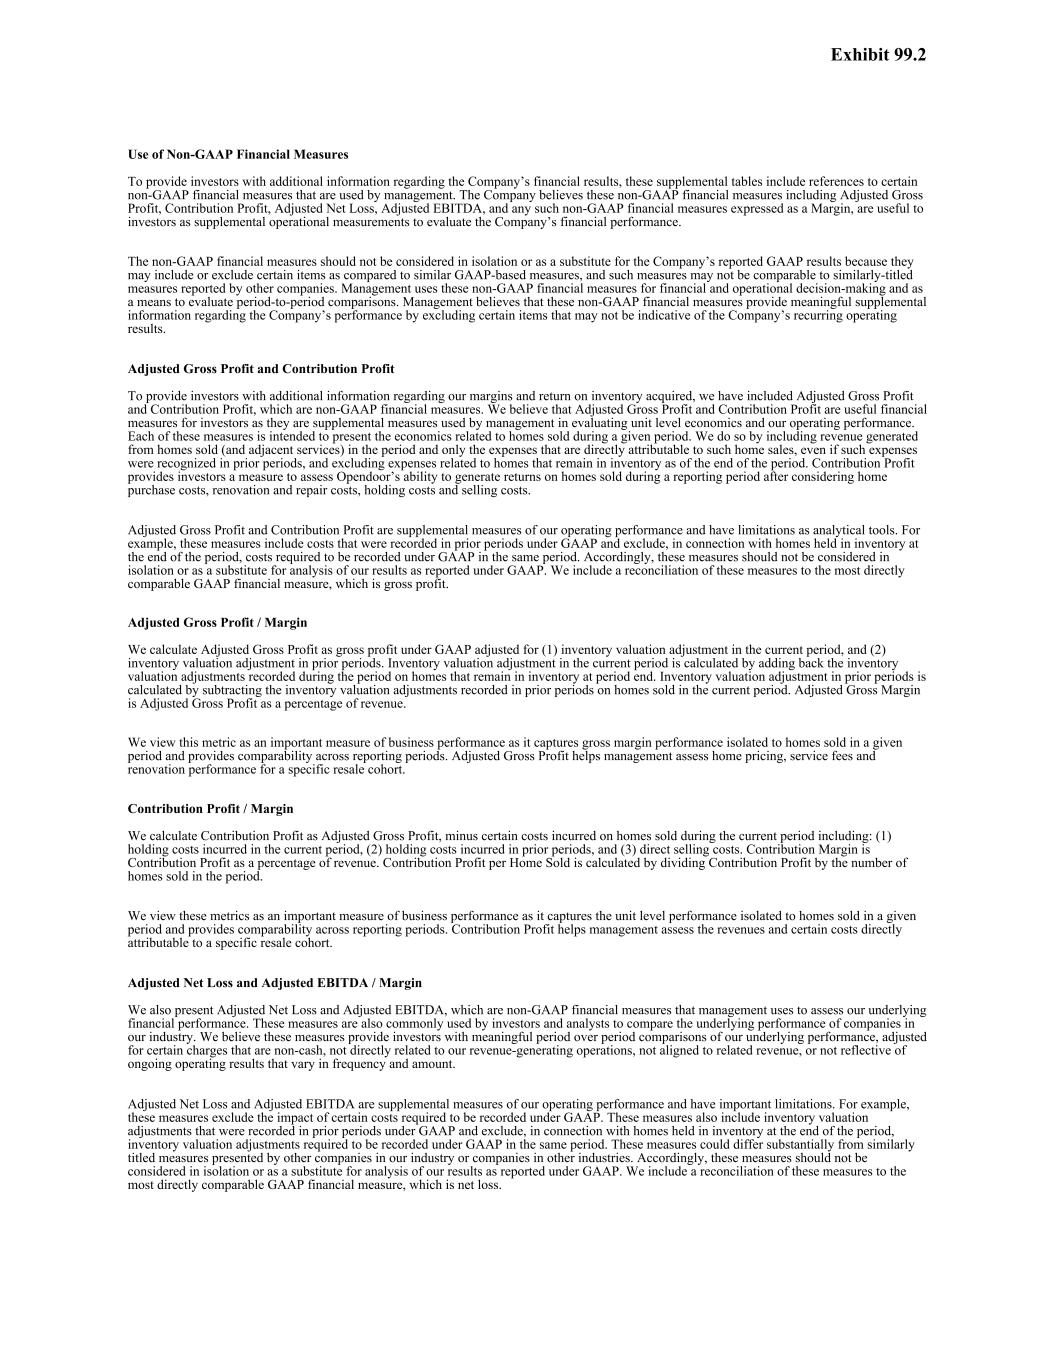
Use of Non-GAAP Financial Measures To provide investors with additional information regarding the Company’s financial results, these supplemental tables include references to certain non-GAAP financial measures that are used by management. The Company believes these non-GAAP financial measures including Adjusted Gross Profit, Contribution Profit, Adjusted Net Loss, Adjusted EBITDA, and any such non-GAAP financial measures expressed as a Margin, are useful to investors as supplemental operational measurements to evaluate the Company’s financial performance. The non-GAAP financial measures should not be considered in isolation or as a substitute for the Company’s reported GAAP results because they may include or exclude certain items as compared to similar GAAP-based measures, and such measures may not be comparable to similarly-titled measures reported by other companies. Management uses these non-GAAP financial measures for financial and operational decision-making and as a means to evaluate period-to-period comparisons. Management believes that these non-GAAP financial measures provide meaningful supplemental information regarding the Company’s performance by excluding certain items that may not be indicative of the Company’s recurring operating results. Adjusted Gross Profit and Contribution Profit To provide investors with additional information regarding our margins and return on inventory acquired, we have included Adjusted Gross Profit and Contribution Profit, which are non-GAAP financial measures. We believe that Adjusted Gross Profit and Contribution Profit are useful financial measures for investors as they are supplemental measures used by management in evaluating unit level economics and our operating performance. Each of these measures is intended to present the economics related to homes sold during a given period. We do so by including revenue generated from homes sold (and adjacent services) in the period and only the expenses that are directly attributable to such home sales, even if such expenses were recognized in prior periods, and excluding expenses related to homes that remain in inventory as of the end of the period. Contribution Profit provides investors a measure to assess Opendoor’s ability to generate returns on homes sold during a reporting period after considering home purchase costs, renovation and repair costs, holding costs and selling costs. Adjusted Gross Profit and Contribution Profit are supplemental measures of our operating performance and have limitations as analytical tools. For example, these measures include costs that were recorded in prior periods under GAAP and exclude, in connection with homes held in inventory at the end of the period, costs required to be recorded under GAAP in the same period. Accordingly, these measures should not be considered in isolation or as a substitute for analysis of our results as reported under GAAP. We include a reconciliation of these measures to the most directly comparable GAAP financial measure, which is gross profit. Adjusted Gross Profit / Margin We calculate Adjusted Gross Profit as gross profit under GAAP adjusted for (1) inventory valuation adjustment in the current period, and (2) inventory valuation adjustment in prior periods. Inventory valuation adjustment in the current period is calculated by adding back the inventory valuation adjustments recorded during the period on homes that remain in inventory at period end. Inventory valuation adjustment in prior periods is calculated by subtracting the inventory valuation adjustments recorded in prior periods on homes sold in the current period. Adjusted Gross Margin is Adjusted Gross Profit as a percentage of revenue. We view this metric as an important measure of business performance as it captures gross margin performance isolated to homes sold in a given period and provides comparability across reporting periods. Adjusted Gross Profit helps management assess home pricing, service fees and renovation performance for a specific resale cohort. Contribution Profit / Margin We calculate Contribution Profit as Adjusted Gross Profit, minus certain costs incurred on homes sold during the current period including: (1) holding costs incurred in the current period, (2) holding costs incurred in prior periods, and (3) direct selling costs. Contribution Margin is Contribution Profit as a percentage of revenue. Contribution Profit per Home Sold is calculated by dividing Contribution Profit by the number of homes sold in the period. We view these metrics as an important measure of business performance as it captures the unit level performance isolated to homes sold in a given period and provides comparability across reporting periods. Contribution Profit helps management assess the revenues and certain costs directly attributable to a specific resale cohort. Adjusted Net Loss and Adjusted EBITDA / Margin We also present Adjusted Net Loss and Adjusted EBITDA, which are non-GAAP financial measures that management uses to assess our underlying financial performance. These measures are also commonly used by investors and analysts to compare the underlying performance of companies in our industry. We believe these measures provide investors with meaningful period over period comparisons of our underlying performance, adjusted for certain charges that are non-cash, not directly related to our revenue-generating operations, not aligned to related revenue, or not reflective of ongoing operating results that vary in frequency and amount. Adjusted Net Loss and Adjusted EBITDA are supplemental measures of our operating performance and have important limitations. For example, these measures exclude the impact of certain costs required to be recorded under GAAP. These measures also include inventory valuation adjustments that were recorded in prior periods under GAAP and exclude, in connection with homes held in inventory at the end of the period, inventory valuation adjustments required to be recorded under GAAP in the same period. These measures could differ substantially from similarly titled measures presented by other companies in our industry or companies in other industries. Accordingly, these measures should not be considered in isolation or as a substitute for analysis of our results as reported under GAAP. We include a reconciliation of these measures to the most directly comparable GAAP financial measure, which is net loss. Exhibit 99.2
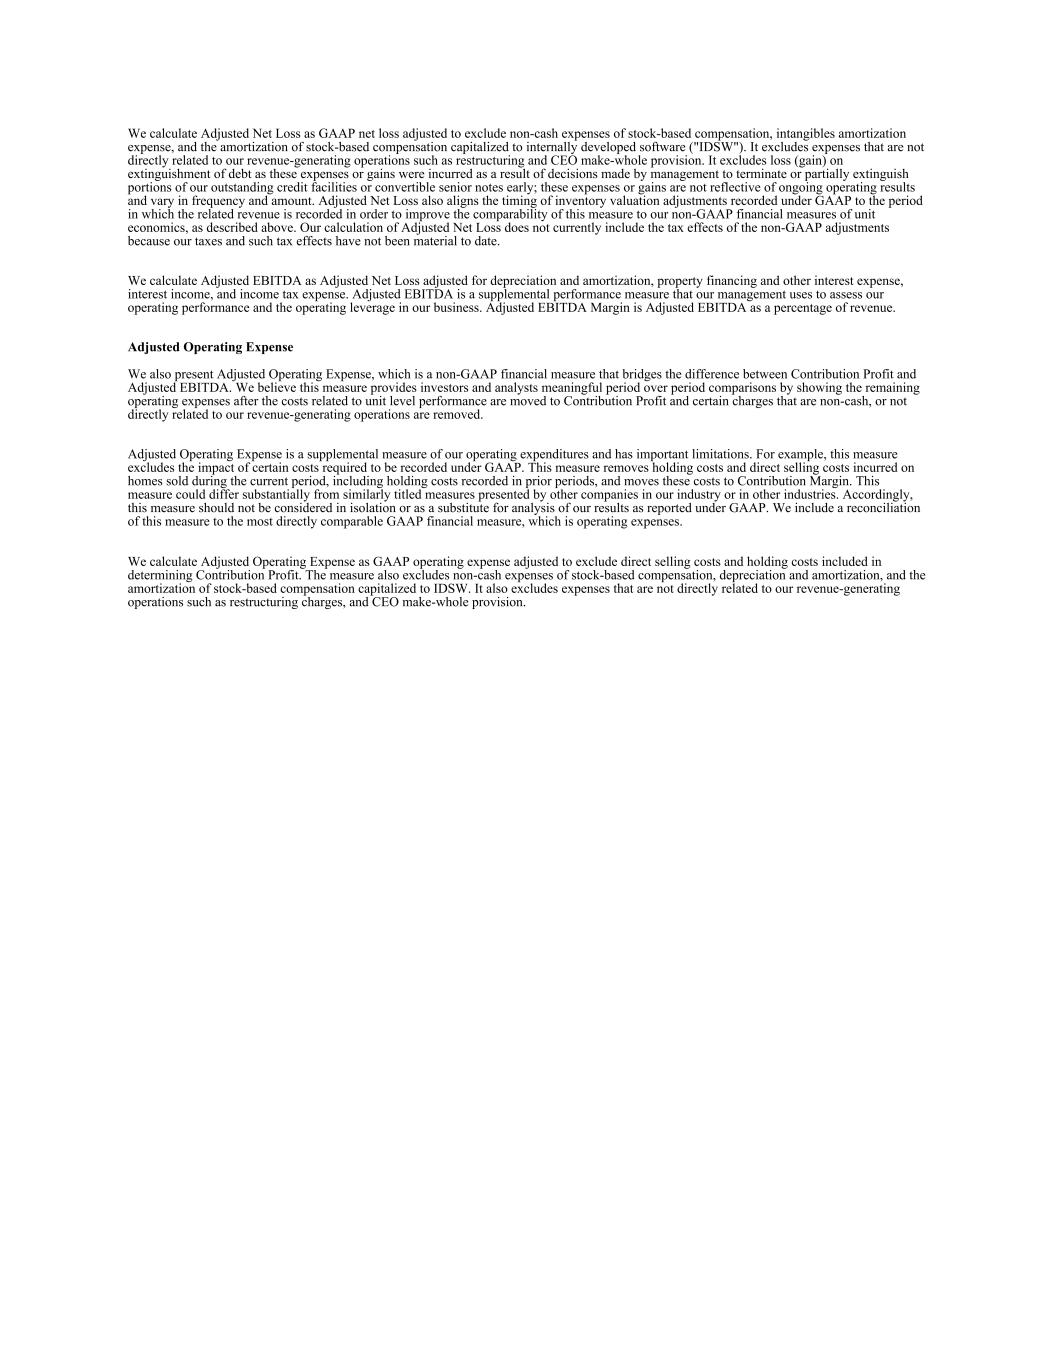
We calculate Adjusted Net Loss as GAAP net loss adjusted to exclude non-cash expenses of stock-based compensation, intangibles amortization expense, and the amortization of stock-based compensation capitalized to internally developed software ("IDSW"). It excludes expenses that are not directly related to our revenue-generating operations such as restructuring and CEO make-whole provision. It excludes loss (gain) on extinguishment of debt as these expenses or gains were incurred as a result of decisions made by management to terminate or partially extinguish portions of our outstanding credit facilities or convertible senior notes early; these expenses or gains are not reflective of ongoing operating results and vary in frequency and amount. Adjusted Net Loss also aligns the timing of inventory valuation adjustments recorded under GAAP to the period in which the related revenue is recorded in order to improve the comparability of this measure to our non-GAAP financial measures of unit economics, as described above. Our calculation of Adjusted Net Loss does not currently include the tax effects of the non-GAAP adjustments because our taxes and such tax effects have not been material to date. We calculate Adjusted EBITDA as Adjusted Net Loss adjusted for depreciation and amortization, property financing and other interest expense, interest income, and income tax expense. Adjusted EBITDA is a supplemental performance measure that our management uses to assess our operating performance and the operating leverage in our business. Adjusted EBITDA Margin is Adjusted EBITDA as a percentage of revenue. Adjusted Operating Expense We also present Adjusted Operating Expense, which is a non-GAAP financial measure that bridges the difference between Contribution Profit and Adjusted EBITDA. We believe this measure provides investors and analysts meaningful period over period comparisons by showing the remaining operating expenses after the costs related to unit level performance are moved to Contribution Profit and certain charges that are non-cash, or not directly related to our revenue-generating operations are removed. Adjusted Operating Expense is a supplemental measure of our operating expenditures and has important limitations. For example, this measure excludes the impact of certain costs required to be recorded under GAAP. This measure removes holding costs and direct selling costs incurred on homes sold during the current period, including holding costs recorded in prior periods, and moves these costs to Contribution Margin. This measure could differ substantially from similarly titled measures presented by other companies in our industry or in other industries. Accordingly, this measure should not be considered in isolation or as a substitute for analysis of our results as reported under GAAP. We include a reconciliation of this measure to the most directly comparable GAAP financial measure, which is operating expenses. We calculate Adjusted Operating Expense as GAAP operating expense adjusted to exclude direct selling costs and holding costs included in determining Contribution Profit. The measure also excludes non-cash expenses of stock-based compensation, depreciation and amortization, and the amortization of stock-based compensation capitalized to IDSW. It also excludes expenses that are not directly related to our revenue-generating operations such as restructuring charges, and CEO make-whole provision.
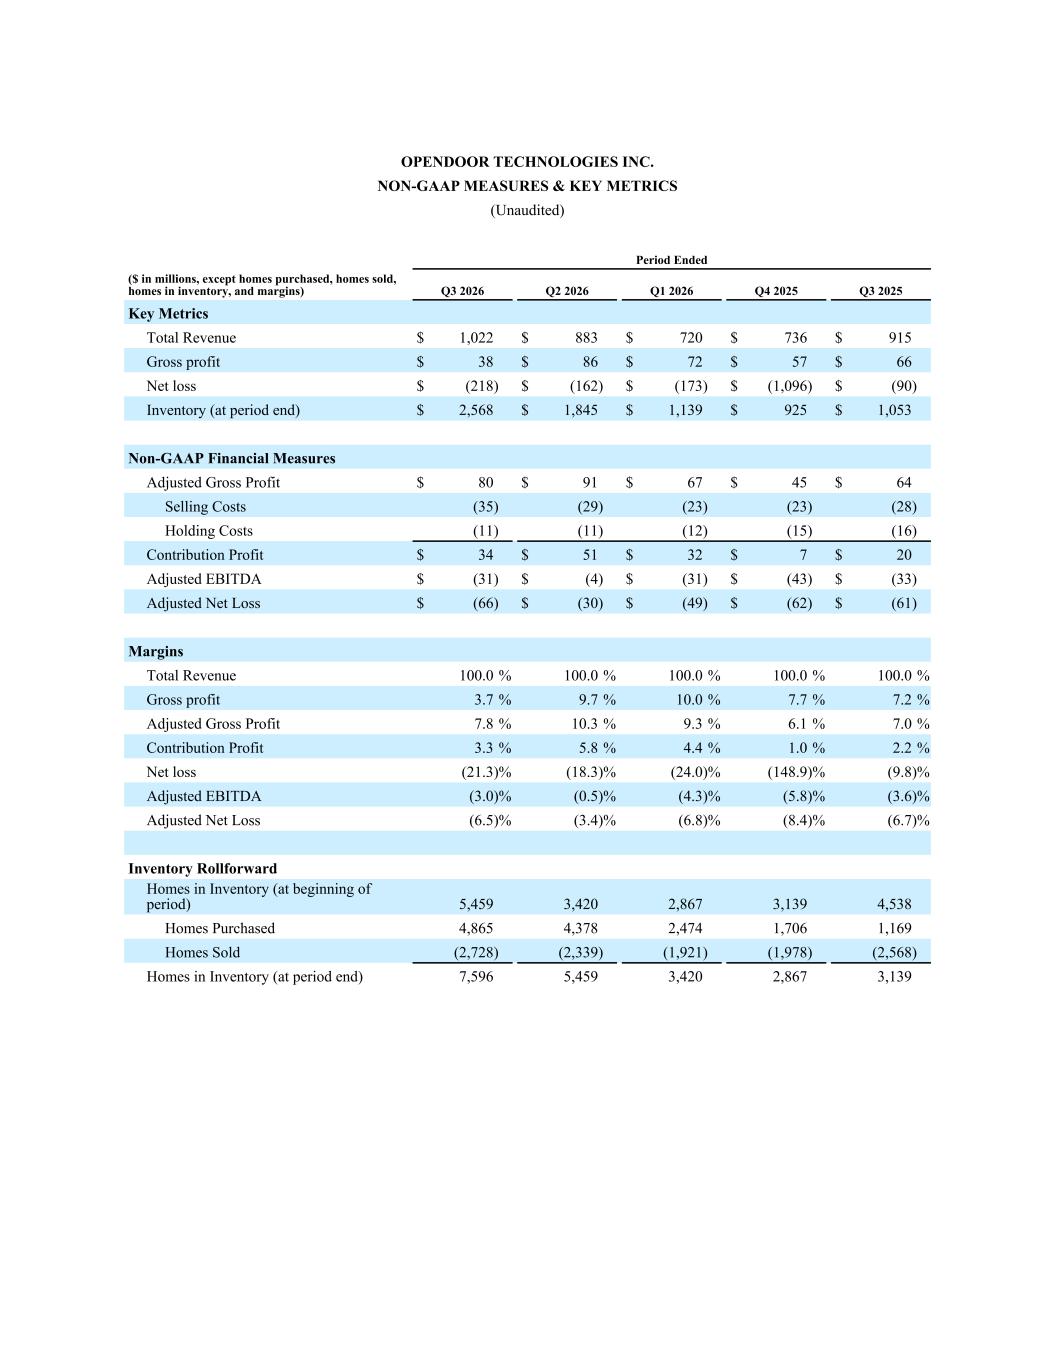
OPENDOOR TECHNOLOGIES INC. NON-GAAP MEASURES & KEY METRICS (Unaudited) Period Ended ($ in millions, except homes purchased, homes sold, homes in inventory, and margins) Q3 2026 Q2 2026 Q1 2026 Q4 2025 Q3 2025 Key Metrics Total Revenue $ 1,022 $ 883 $ 720 $ 736 $ 915 Gross profit $ 38 $ 86 $ 72 $ 57 $ 66 Net loss $ (218) $ (162) $ (173) $ (1,096) $ (90) Inventory (at period end) $ 2,568 $ 1,845 $ 1,139 $ 925 $ 1,053 Non-GAAP Financial Measures Adjusted Gross Profit $ 80 $ 91 $ 67 $ 45 $ 64 Selling Costs (35) (29) (23) (23) (28) Holding Costs (11) (11) (12) (15) (16) Contribution Profit $ 34 $ 51 $ 32 $ 7 $ 20 Adjusted EBITDA $ (31) $ (4) $ (31) $ (43) $ (33) Adjusted Net Loss $ (66) $ (30) $ (49) $ (62) $ (61) Margins Total Revenue 100.0 % 100.0 % 100.0 % 100.0 % 100.0 % Gross profit 3.7 % 9.7 % 10.0 % 7.7 % 7.2 % Adjusted Gross Profit 7.8 % 10.3 % 9.3 % 6.1 % 7.0 % Contribution Profit 3.3 % 5.8 % 4.4 % 1.0 % 2.2 % Net loss (21.3) % (18.3) % (24.0) % (148.9) % (9.8) % Adjusted EBITDA (3.0) % (0.5) % (4.3) % (5.8) % (3.6) % Adjusted Net Loss (6.5) % (3.4) % (6.8) % (8.4) % (6.7) % Inventory Rollforward Homes in Inventory (at beginning of period) 5,459 3,420 2,867 3,139 4,538 Homes Purchased 4,865 4,378 2,474 1,706 1,169 Homes Sold (2,728) (2,339) (1,921) (1,978) (2,568) Homes in Inventory (at period end) 7,596 5,459 3,420 2,867 3,139
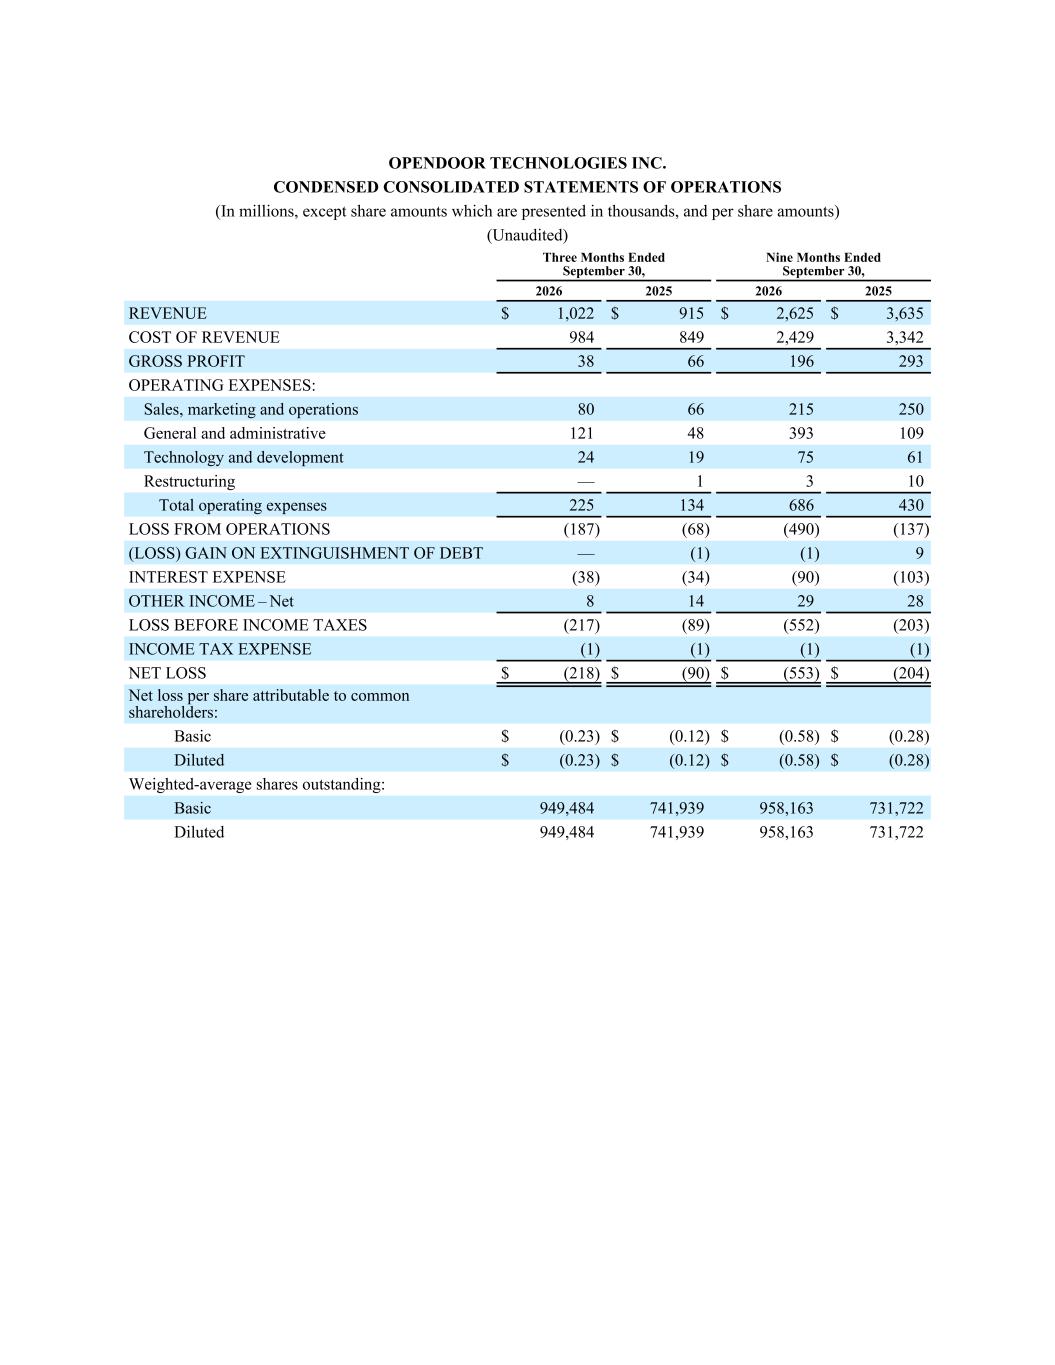
OPENDOOR TECHNOLOGIES INC. CONDENSED CONSOLIDATED STATEMENTS OF OPERATIONS (In millions, except share amounts which are presented in thousands, and per share amounts) (Unaudited) Three Months Ended September 30, Nine Months Ended September 30, 2026 2025 2026 2025 REVENUE $ 1,022 $ 915 $ 2,625 $ 3,635 COST OF REVENUE 984 849 2,429 3,342 GROSS PROFIT 38 66 196 293 OPERATING EXPENSES: Sales, marketing and operations 80 66 215 250 General and administrative 121 48 393 109 Technology and development 24 19 75 61 Restructuring — 1 3 10 Total operating expenses 225 134 686 430 LOSS FROM OPERATIONS (187) (68) (490) (137) (LOSS) GAIN ON EXTINGUISHMENT OF DEBT — (1) (1) 9 INTEREST EXPENSE (38) (34) (90) (103) OTHER INCOME – Net 8 14 29 28 LOSS BEFORE INCOME TAXES (217) (89) (552) (203) INCOME TAX EXPENSE (1) (1) (1) (1) NET LOSS $ (218) $ (90) $ (553) $ (204) Net loss per share attributable to common shareholders: Basic $ (0.23) $ (0.12) $ (0.58) $ (0.28) Diluted $ (0.23) $ (0.12) $ (0.58) $ (0.28) Weighted-average shares outstanding: Basic 949,484 741,939 958,163 731,722 Diluted 949,484 741,939 958,163 731,722
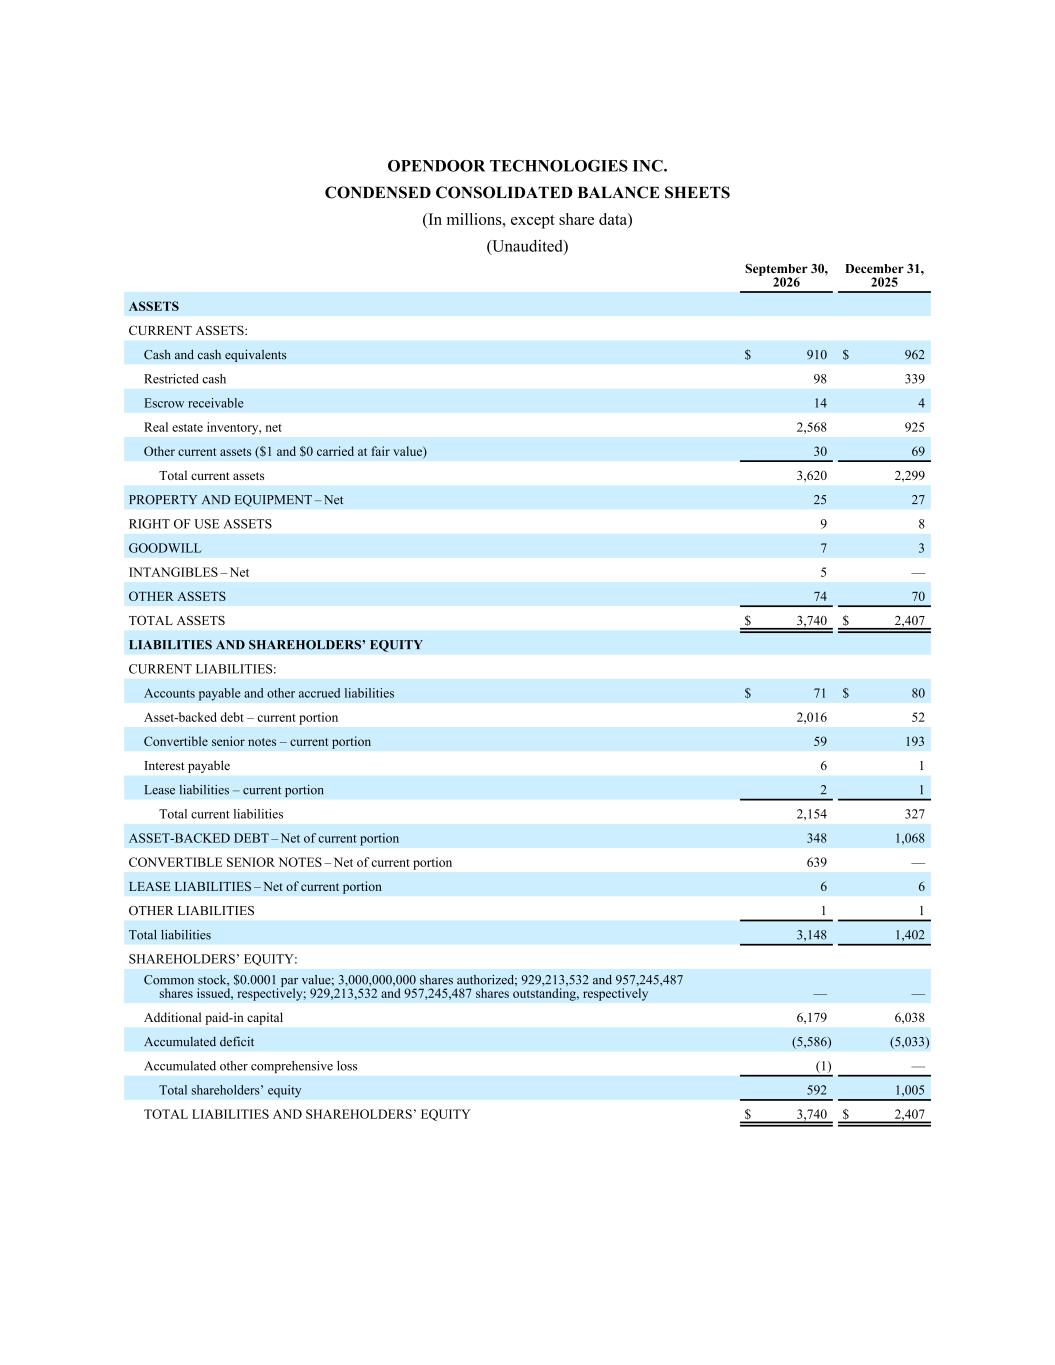
OPENDOOR TECHNOLOGIES INC. CONDENSED CONSOLIDATED BALANCE SHEETS (In millions, except share data) (Unaudited) September 30, 2026 December 31, 2025 ASSETS CURRENT ASSETS: Cash and cash equivalents $ 910 $ 962 Restricted cash 98 339 Escrow receivable 14 4 Real estate inventory, net 2,568 925 Other current assets ($1 and $0 carried at fair value) 30 69 Total current assets 3,620 2,299 PROPERTY AND EQUIPMENT – Net 25 27 RIGHT OF USE ASSETS 9 8 GOODWILL 7 3 INTANGIBLES – Net 5 — OTHER ASSETS 74 70 TOTAL ASSETS $ 3,740 $ 2,407 LIABILITIES AND SHAREHOLDERS’ EQUITY CURRENT LIABILITIES: Accounts payable and other accrued liabilities $ 71 $ 80 Asset-backed debt – current portion 2,016 52 Convertible senior notes – current portion 59 193 Interest payable 6 1 Lease liabilities – current portion 2 1 Total current liabilities 2,154 327 ASSET-BACKED DEBT – Net of current portion 348 1,068 CONVERTIBLE SENIOR NOTES – Net of current portion 639 — LEASE LIABILITIES – Net of current portion 6 6 OTHER LIABILITIES 1 1 Total liabilities 3,148 1,402 SHAREHOLDERS’ EQUITY: Common stock, $0.0001 par value; 3,000,000,000 shares authorized; 929,213,532 and 957,245,487 shares issued, respectively; 929,213,532 and 957,245,487 shares outstanding, respectively — — Additional paid-in capital 6,179 6,038 Accumulated deficit (5,586) (5,033) Accumulated other comprehensive loss (1) — Total shareholders’ equity 592 1,005 TOTAL LIABILITIES AND SHAREHOLDERS’ EQUITY $ 3,740 $ 2,407
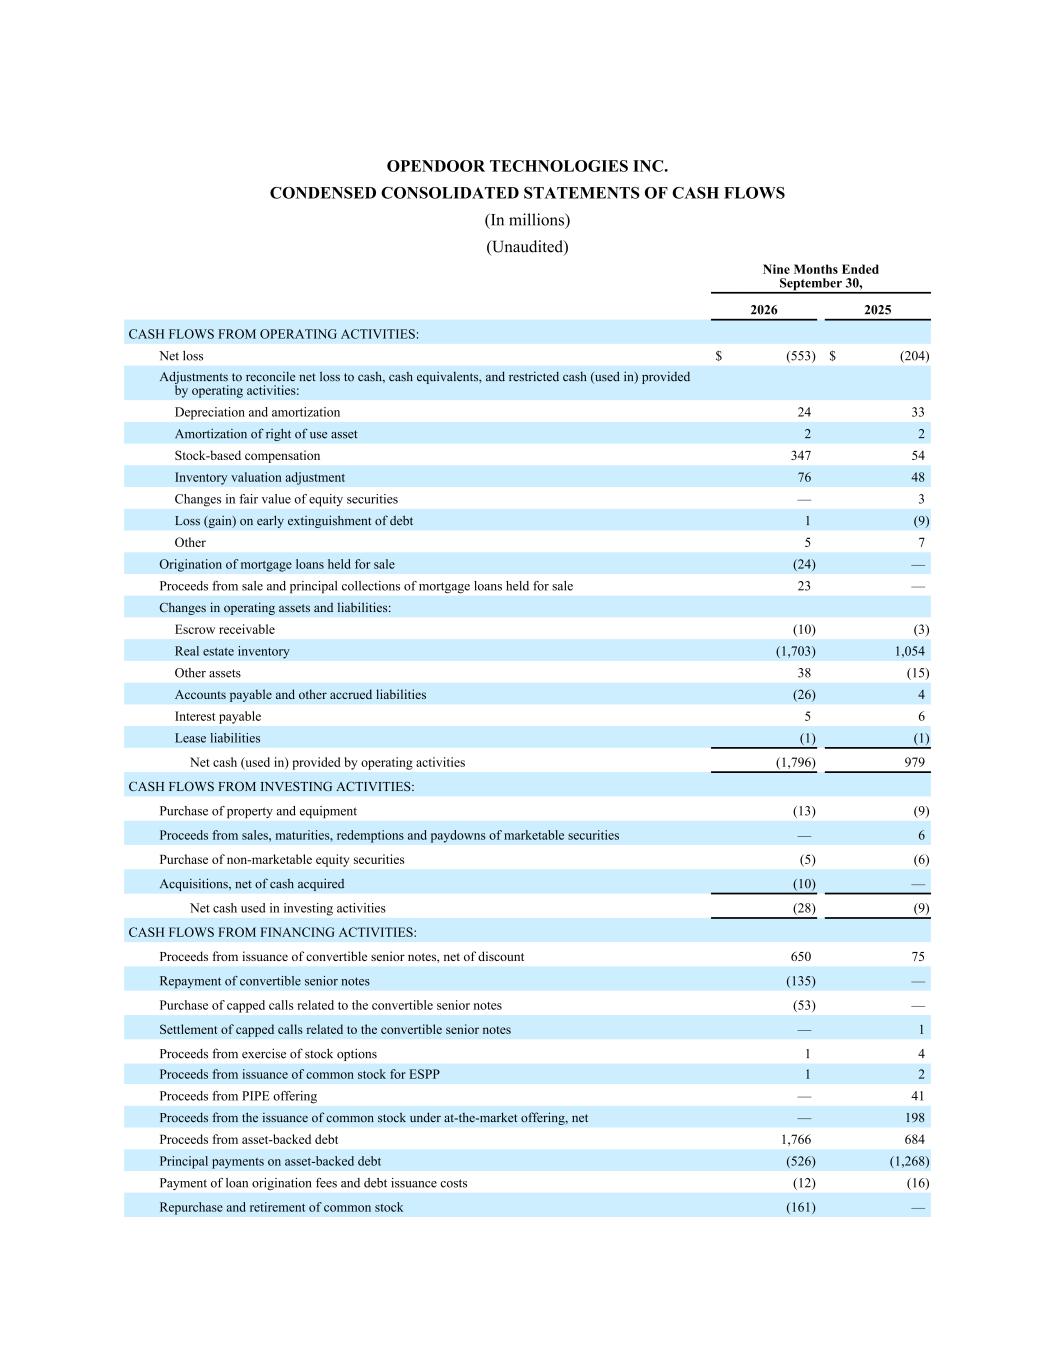
OPENDOOR TECHNOLOGIES INC. CONDENSED CONSOLIDATED STATEMENTS OF CASH FLOWS (In millions) (Unaudited) Nine Months Ended September 30, 2026 2025 CASH FLOWS FROM OPERATING ACTIVITIES: Net loss $ (553) $ (204) Adjustments to reconcile net loss to cash, cash equivalents, and restricted cash (used in) provided by operating activities: Depreciation and amortization 24 33 Amortization of right of use asset 2 2 Stock-based compensation 347 54 Inventory valuation adjustment 76 48 Changes in fair value of equity securities — 3 Loss (gain) on early extinguishment of debt 1 (9) Other 5 7 Origination of mortgage loans held for sale (24) — Proceeds from sale and principal collections of mortgage loans held for sale 23 — Changes in operating assets and liabilities: Escrow receivable (10) (3) Real estate inventory (1,703) 1,054 Other assets 38 (15) Accounts payable and other accrued liabilities (26) 4 Interest payable 5 6 Lease liabilities (1) (1) Net cash (used in) provided by operating activities (1,796) 979 CASH FLOWS FROM INVESTING ACTIVITIES: Purchase of property and equipment (13) (9) Proceeds from sales, maturities, redemptions and paydowns of marketable securities — 6 Purchase of non-marketable equity securities (5) (6) Acquisitions, net of cash acquired (10) — Net cash used in investing activities (28) (9) CASH FLOWS FROM FINANCING ACTIVITIES: Proceeds from issuance of convertible senior notes, net of discount 650 75 Repayment of convertible senior notes (135) — Purchase of capped calls related to the convertible senior notes (53) — Settlement of capped calls related to the convertible senior notes — 1 Proceeds from exercise of stock options 1 4 Proceeds from issuance of common stock for ESPP 1 2 Proceeds from PIPE offering — 41 Proceeds from the issuance of common stock under at-the-market offering, net — 198 Proceeds from asset-backed debt 1,766 684 Principal payments on asset-backed debt (526) (1,268) Payment of loan origination fees and debt issuance costs (12) (16) Repurchase and retirement of common stock (161) —
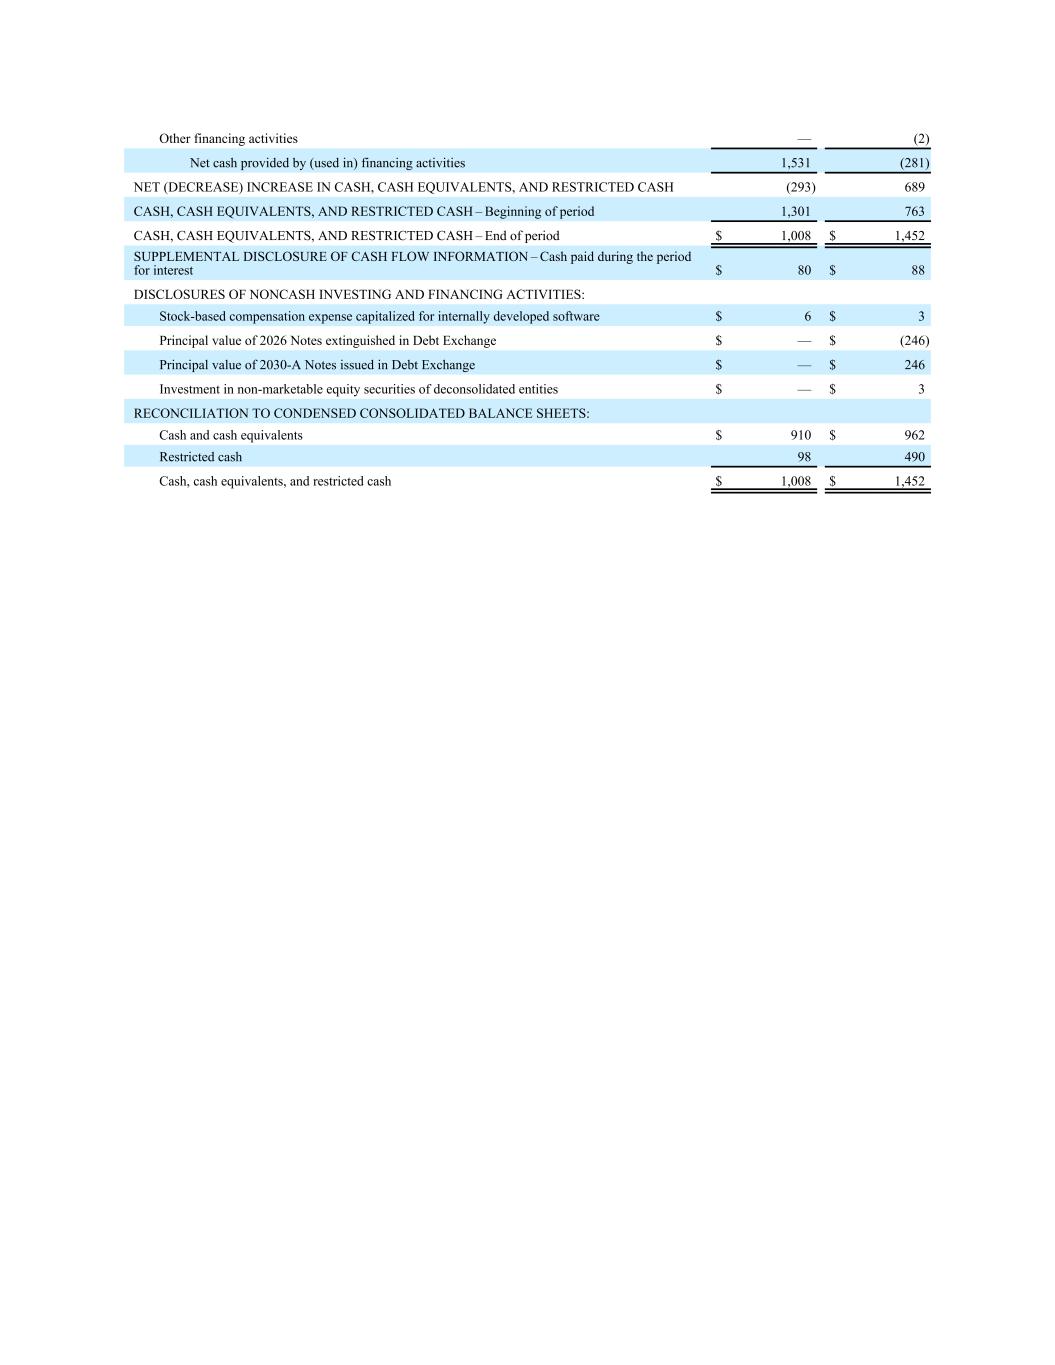
Other financing activities — (2) Net cash provided by (used in) financing activities 1,531 (281) NET (DECREASE) INCREASE IN CASH, CASH EQUIVALENTS, AND RESTRICTED CASH (293) 689 CASH, CASH EQUIVALENTS, AND RESTRICTED CASH – Beginning of period 1,301 763 CASH, CASH EQUIVALENTS, AND RESTRICTED CASH – End of period $ 1,008 $ 1,452 SUPPLEMENTAL DISCLOSURE OF CASH FLOW INFORMATION – Cash paid during the period for interest $ 80 $ 88 DISCLOSURES OF NONCASH INVESTING AND FINANCING ACTIVITIES: Stock-based compensation expense capitalized for internally developed software $ 6 $ 3 Principal value of 2026 Notes extinguished in Debt Exchange $ — $ (246) Principal value of 2030-A Notes issued in Debt Exchange $ — $ 246 Investment in non-marketable equity securities of deconsolidated entities $ — $ 3 RECONCILIATION TO CONDENSED CONSOLIDATED BALANCE SHEETS: Cash and cash equivalents $ 910 $ 962 Restricted cash 98 490 Cash, cash equivalents, and restricted cash $ 1,008 $ 1,452
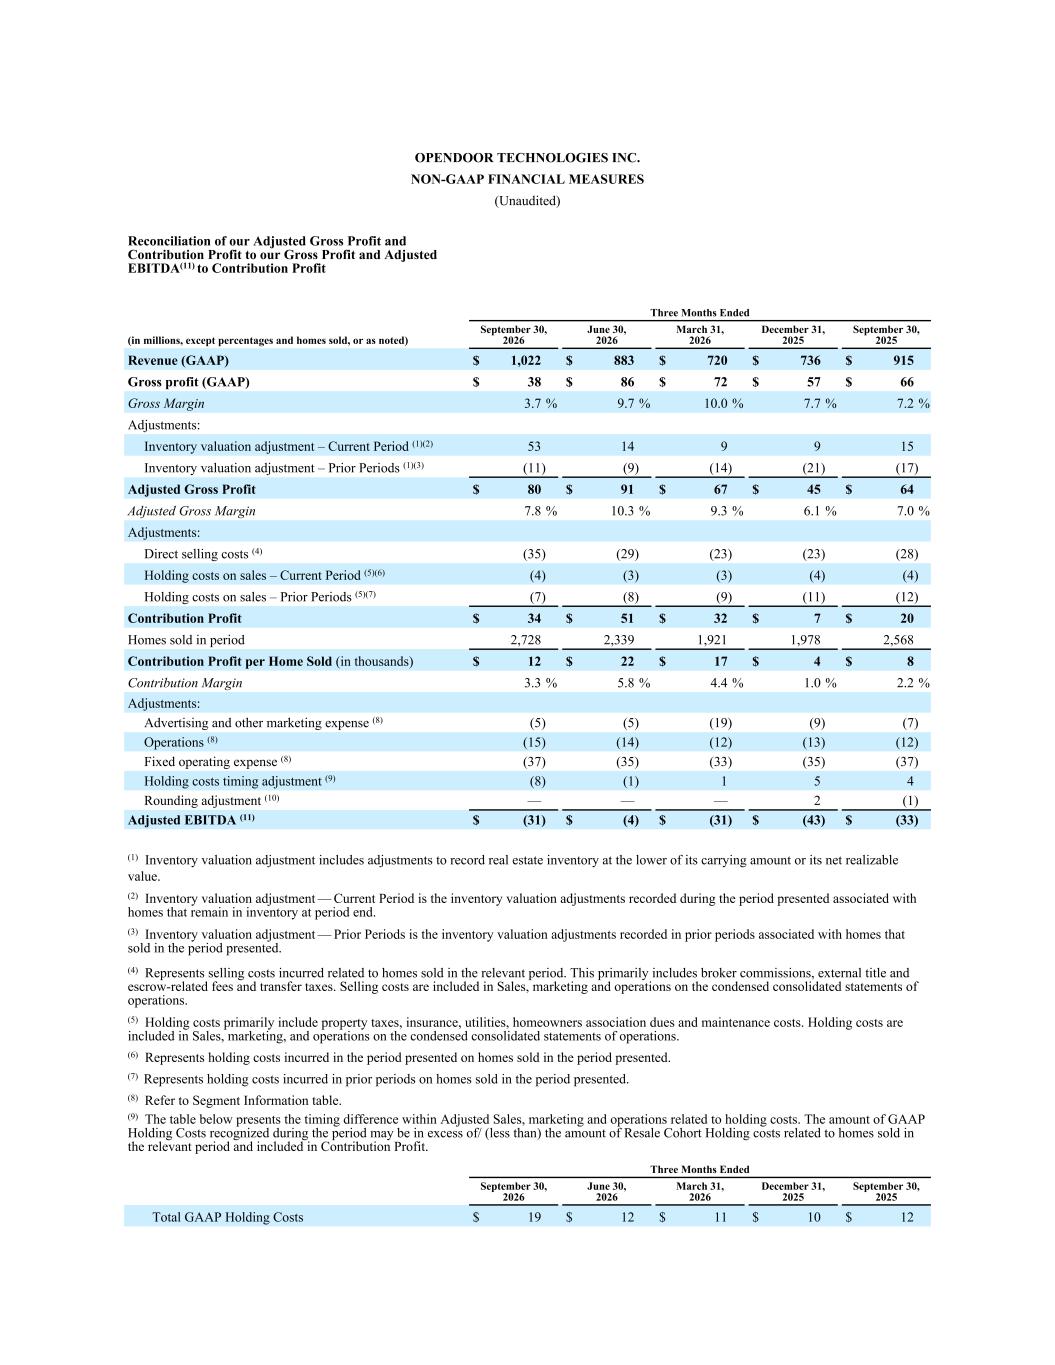
OPENDOOR TECHNOLOGIES INC. NON-GAAP FINANCIAL MEASURES (Unaudited) Reconciliation of our Adjusted Gross Profit and Contribution Profit to our Gross Profit and Adjusted EBITDA(11) to Contribution Profit Three Months Ended (in millions, except percentages and homes sold, or as noted) September 30, 2026 June 30, 2026 March 31, 2026 December 31, 2025 September 30, 2025 Revenue (GAAP) $ 1,022 $ 883 $ 720 $ 736 $ 915 Gross profit (GAAP) $ 38 $ 86 $ 72 $ 57 $ 66 Gross Margin 3.7 % 9.7 % 10.0 % 7.7 % 7.2 % Adjustments: Inventory valuation adjustment – Current Period (1)(2) 53 14 9 9 15 Inventory valuation adjustment – Prior Periods (1)(3) (11) (9) (14) (21) (17) Adjusted Gross Profit $ 80 $ 91 $ 67 $ 45 $ 64 Adjusted Gross Margin 7.8 % 10.3 % 9.3 % 6.1 % 7.0 % Adjustments: Direct selling costs (4) (35) (29) (23) (23) (28) Holding costs on sales – Current Period (5)(6) (4) (3) (3) (4) (4) Holding costs on sales – Prior Periods (5)(7) (7) (8) (9) (11) (12) Contribution Profit $ 34 $ 51 $ 32 $ 7 $ 20 Homes sold in period 2,728 2,339 1,921 1,978 2,568 Contribution Profit per Home Sold (in thousands) $ 12 $ 22 $ 17 $ 4 $ 8 Contribution Margin 3.3 % 5.8 % 4.4 % 1.0 % 2.2 % Adjustments: Advertising and other marketing expense (8) (5) (5) (19) (9) (7) Operations (8) (15) (14) (12) (13) (12) Fixed operating expense (8) (37) (35) (33) (35) (37) Holding costs timing adjustment (9) (8) (1) 1 5 4 Rounding adjustment (10) — — — 2 (1) Adjusted EBITDA (11) $ (31) $ (4) $ (31) $ (43) $ (33) (1) Inventory valuation adjustment includes adjustments to record real estate inventory at the lower of its carrying amount or its net realizable value. (2) Inventory valuation adjustment — Current Period is the inventory valuation adjustments recorded during the period presented associated with homes that remain in inventory at period end. (3) Inventory valuation adjustment — Prior Periods is the inventory valuation adjustments recorded in prior periods associated with homes that sold in the period presented. (4) Represents selling costs incurred related to homes sold in the relevant period. This primarily includes broker commissions, external title and escrow-related fees and transfer taxes. Selling costs are included in Sales, marketing and operations on the condensed consolidated statements of operations. (5) Holding costs primarily include property taxes, insurance, utilities, homeowners association dues and maintenance costs. Holding costs are included in Sales, marketing, and operations on the condensed consolidated statements of operations. (6) Represents holding costs incurred in the period presented on homes sold in the period presented. (7) Represents holding costs incurred in prior periods on homes sold in the period presented. (8) Refer to Segment Information table. (9) The table below presents the timing difference within Adjusted Sales, marketing and operations related to holding costs. The amount of GAAP Holding Costs recognized during the period may be in excess of/ (less than) the amount of Resale Cohort Holding costs related to homes sold in the relevant period and included in Contribution Profit. Three Months Ended September 30, 2026 June 30, 2026 March 31, 2026 December 31, 2025 September 30, 2025 Total GAAP Holding Costs $ 19 $ 12 $ 11 $ 10 $ 12
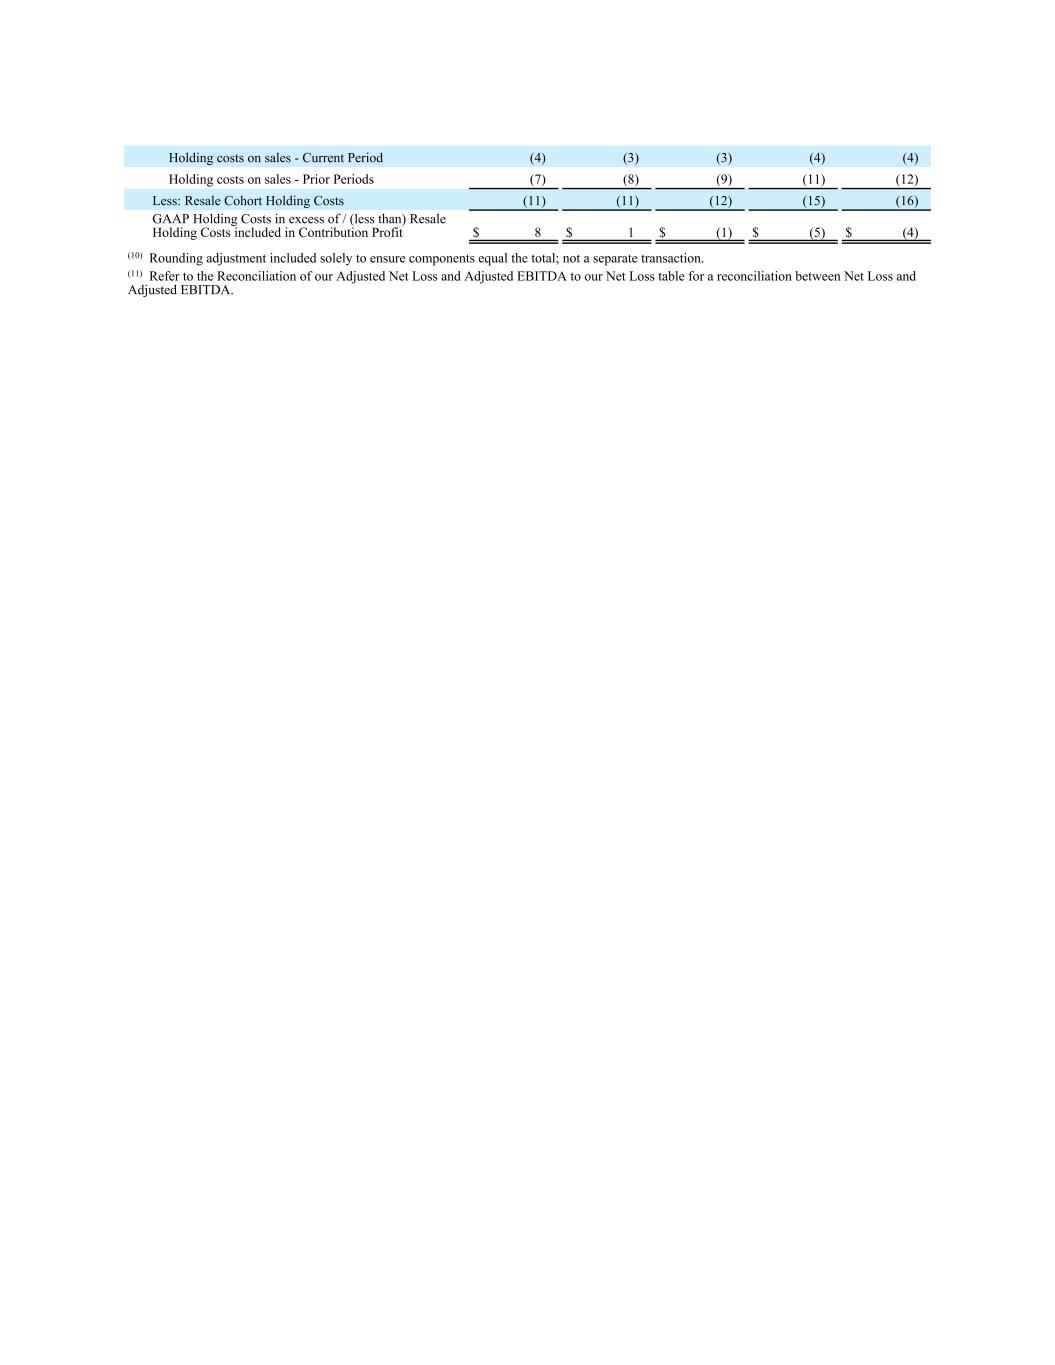
Holding costs on sales - Current Period (4) (3) (3) (4) (4) Holding costs on sales - Prior Periods (7) (8) (9) (11) (12) Less: Resale Cohort Holding Costs (11) (11) (12) (15) (16) GAAP Holding Costs in excess of / (less than) Resale Holding Costs included in Contribution Profit $ 8 $ 1 $ (1) $ (5) $ (4) (10) Rounding adjustment included solely to ensure components equal the total; not a separate transaction. (11) Refer to the Reconciliation of our Adjusted Net Loss and Adjusted EBITDA to our Net Loss table for a reconciliation between Net Loss and Adjusted EBITDA.
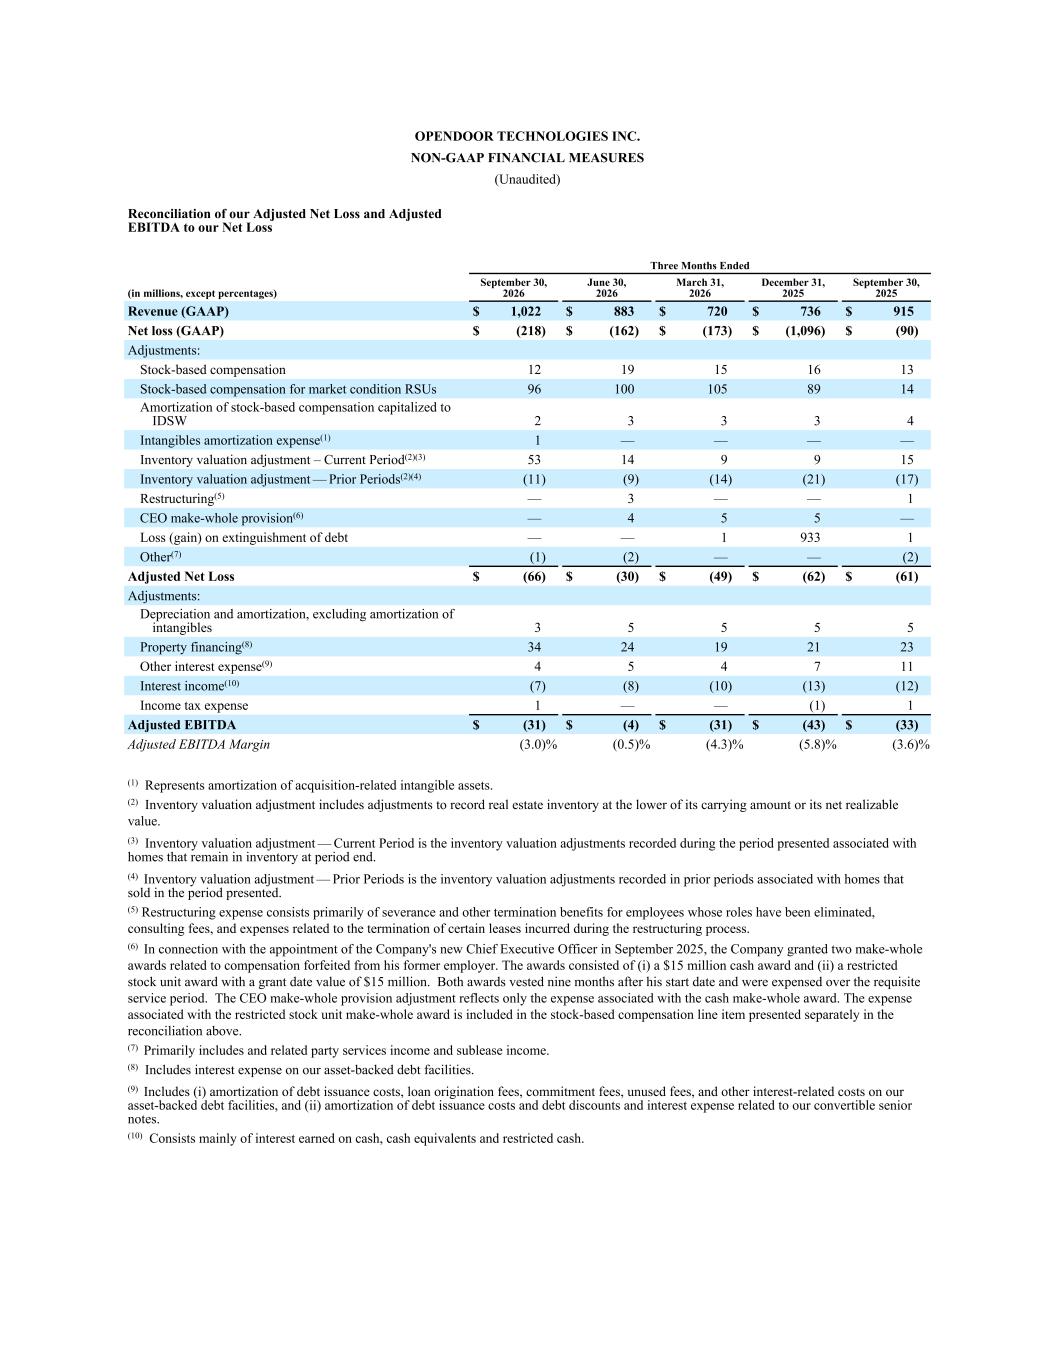
OPENDOOR TECHNOLOGIES INC. NON-GAAP FINANCIAL MEASURES (Unaudited) Reconciliation of our Adjusted Net Loss and Adjusted EBITDA to our Net Loss Three Months Ended (in millions, except percentages) September 30, 2026 June 30, 2026 March 31, 2026 December 31, 2025 September 30, 2025 Revenue (GAAP) $ 1,022 $ 883 $ 720 $ 736 $ 915 Net loss (GAAP) $ (218) $ (162) $ (173) $ (1,096) $ (90) Adjustments: Stock-based compensation 12 19 15 16 13 Stock-based compensation for market condition RSUs 96 100 105 89 14 Amortization of stock-based compensation capitalized to IDSW 2 3 3 3 4 Intangibles amortization expense(1) 1 — — — — Inventory valuation adjustment – Current Period(2)(3) 53 14 9 9 15 Inventory valuation adjustment — Prior Periods(2)(4) (11) (9) (14) (21) (17) Restructuring(5) — 3 — — 1 CEO make-whole provision(6) — 4 5 5 — Loss (gain) on extinguishment of debt — — 1 933 1 Other(7) (1) (2) — — (2) Adjusted Net Loss $ (66) $ (30) $ (49) $ (62) $ (61) Adjustments: Depreciation and amortization, excluding amortization of intangibles 3 5 5 5 5 Property financing(8) 34 24 19 21 23 Other interest expense(9) 4 5 4 7 11 Interest income(10) (7) (8) (10) (13) (12) Income tax expense 1 — — (1) 1 Adjusted EBITDA $ (31) $ (4) $ (31) $ (43) $ (33) Adjusted EBITDA Margin (3.0) % (0.5) % (4.3) % (5.8) % (3.6) % (1) Represents amortization of acquisition-related intangible assets. (2) Inventory valuation adjustment includes adjustments to record real estate inventory at the lower of its carrying amount or its net realizable value. (3) Inventory valuation adjustment — Current Period is the inventory valuation adjustments recorded during the period presented associated with homes that remain in inventory at period end. (4) Inventory valuation adjustment — Prior Periods is the inventory valuation adjustments recorded in prior periods associated with homes that sold in the period presented. (5) Restructuring expense consists primarily of severance and other termination benefits for employees whose roles have been eliminated, consulting fees, and expenses related to the termination of certain leases incurred during the restructuring process. (6) In connection with the appointment of the Company's new Chief Executive Officer in September 2025, the Company granted two make-whole awards related to compensation forfeited from his former employer. The awards consisted of (i) a $15 million cash award and (ii) a restricted stock unit award with a grant date value of $15 million. Both awards vested nine months after his start date and were expensed over the requisite service period. The CEO make-whole provision adjustment reflects only the expense associated with the cash make-whole award. The expense associated with the restricted stock unit make-whole award is included in the stock-based compensation line item presented separately in the reconciliation above. (7) Primarily includes and related party services income and sublease income. (8) Includes interest expense on our asset-backed debt facilities. (9) Includes (i) amortization of debt issuance costs, loan origination fees, commitment fees, unused fees, and other interest-related costs on our asset-backed debt facilities, and (ii) amortization of debt issuance costs and debt discounts and interest expense related to our convertible senior notes. (10) Consists mainly of interest earned on cash, cash equivalents and restricted cash.
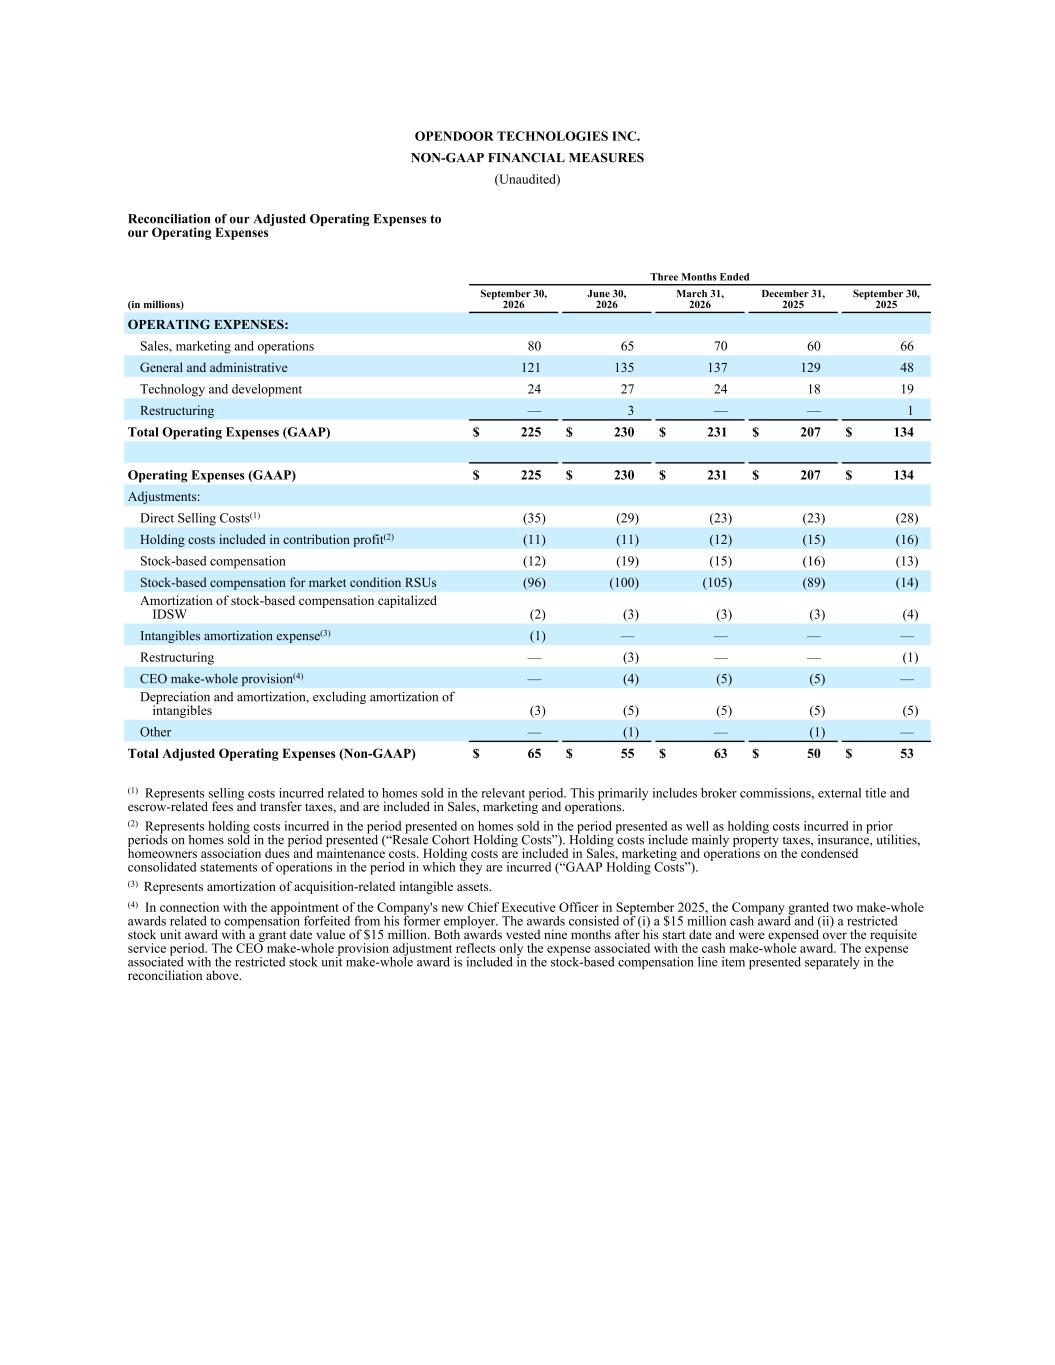
OPENDOOR TECHNOLOGIES INC. NON-GAAP FINANCIAL MEASURES (Unaudited) Reconciliation of our Adjusted Operating Expenses to our Operating Expenses Three Months Ended (in millions) September 30, 2026 June 30, 2026 March 31, 2026 December 31, 2025 September 30, 2025 OPERATING EXPENSES: Sales, marketing and operations 80 65 70 60 66 General and administrative 121 135 137 129 48 Technology and development 24 27 24 18 19 Restructuring — 3 — — 1 Total Operating Expenses (GAAP) $ 225 $ 230 $ 231 $ 207 $ 134 Operating Expenses (GAAP) $ 225 $ 230 $ 231 $ 207 $ 134 Adjustments: Direct Selling Costs(1) (35) (29) (23) (23) (28) Holding costs included in contribution profit(2) (11) (11) (12) (15) (16) Stock-based compensation (12) (19) (15) (16) (13) Stock-based compensation for market condition RSUs (96) (100) (105) (89) (14) Amortization of stock-based compensation capitalized IDSW (2) (3) (3) (3) (4) Intangibles amortization expense(3) (1) — — — — Restructuring — (3) — — (1) CEO make-whole provision(4) — (4) (5) (5) — Depreciation and amortization, excluding amortization of intangibles (3) (5) (5) (5) (5) Other — (1) — (1) — Total Adjusted Operating Expenses (Non-GAAP) $ 65 $ 55 $ 63 $ 50 $ 53 (1) Represents selling costs incurred related to homes sold in the relevant period. This primarily includes broker commissions, external title and escrow-related fees and transfer taxes, and are included in Sales, marketing and operations. (2) Represents holding costs incurred in the period presented on homes sold in the period presented as well as holding costs incurred in prior periods on homes sold in the period presented (“Resale Cohort Holding Costs”). Holding costs include mainly property taxes, insurance, utilities, homeowners association dues and maintenance costs. Holding costs are included in Sales, marketing and operations on the condensed consolidated statements of operations in the period in which they are incurred (“GAAP Holding Costs”). (3) Represents amortization of acquisition-related intangible assets. (4) In connection with the appointment of the Company's new Chief Executive Officer in September 2025, the Company granted two make-whole awards related to compensation forfeited from his former employer. The awards consisted of (i) a $15 million cash award and (ii) a restricted stock unit award with a grant date value of $15 million. Both awards vested nine months after his start date and were expensed over the requisite service period. The CEO make-whole provision adjustment reflects only the expense associated with the cash make-whole award. The expense associated with the restricted stock unit make-whole award is included in the stock-based compensation line item presented separately in the reconciliation above.
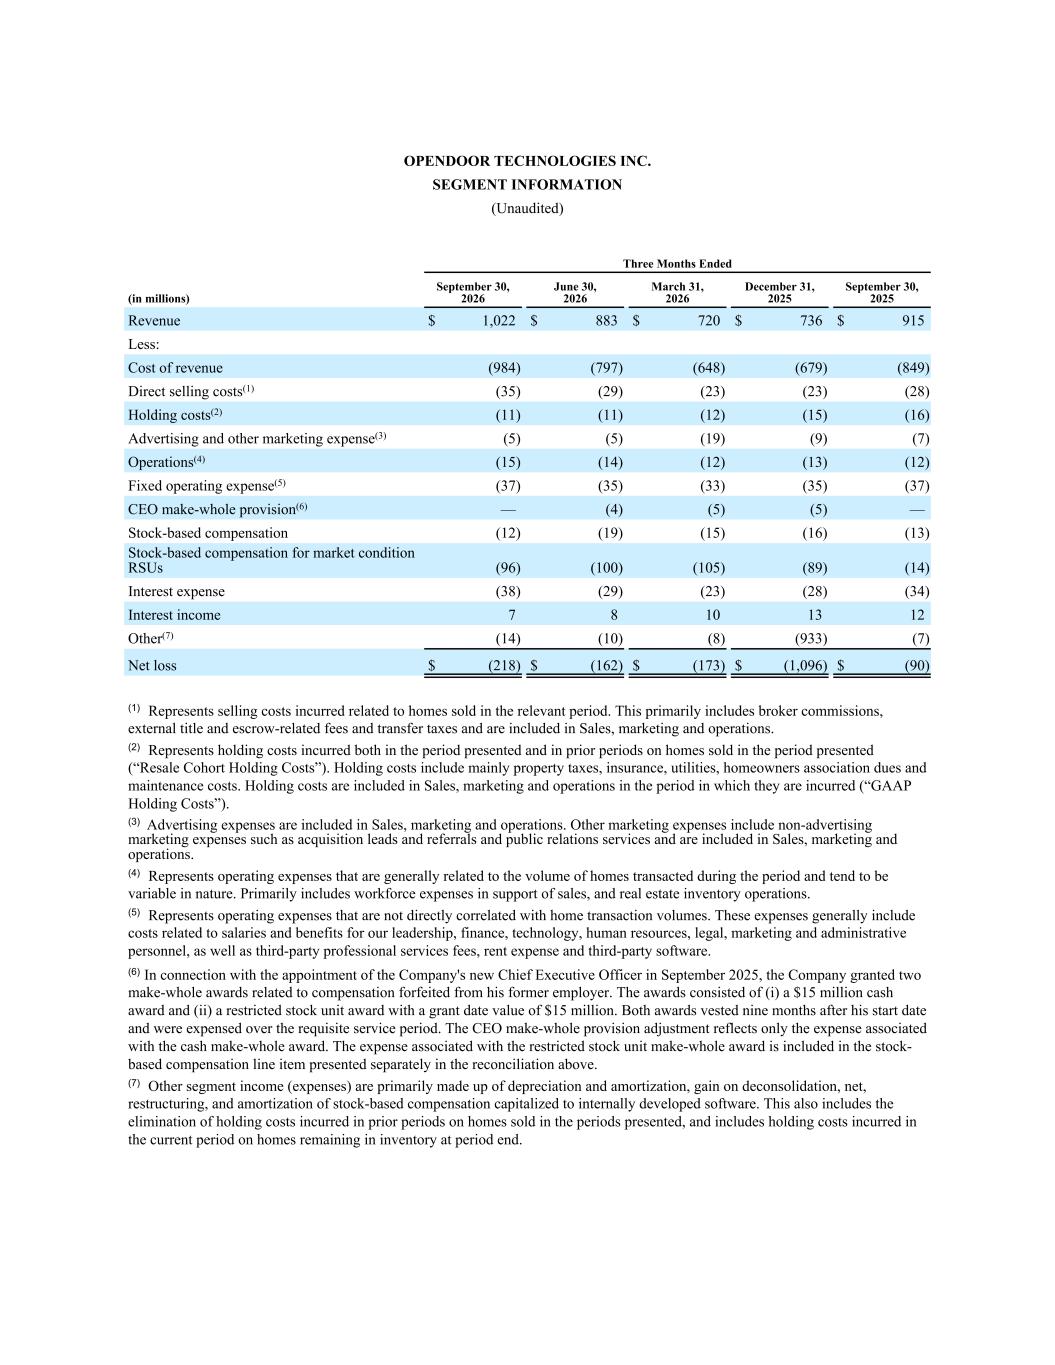
OPENDOOR TECHNOLOGIES INC. SEGMENT INFORMATION (Unaudited) Three Months Ended (in millions) September 30, 2026 June 30, 2026 March 31, 2026 December 31, 2025 September 30, 2025 Revenue $ 1,022 $ 883 $ 720 $ 736 $ 915 Less: Cost of revenue (984) (797) (648) (679) (849) Direct selling costs(1) (35) (29) (23) (23) (28) Holding costs(2) (11) (11) (12) (15) (16) Advertising and other marketing expense(3) (5) (5) (19) (9) (7) Operations(4) (15) (14) (12) (13) (12) Fixed operating expense(5) (37) (35) (33) (35) (37) CEO make-whole provision(6) — (4) (5) (5) — Stock-based compensation (12) (19) (15) (16) (13) Stock-based compensation for market condition RSUs (96) (100) (105) (89) (14) Interest expense (38) (29) (23) (28) (34) Interest income 7 8 10 13 12 Other(7) (14) (10) (8) (933) (7) Net loss $ (218) $ (162) $ (173) $ (1,096) $ (90) (1) Represents selling costs incurred related to homes sold in the relevant period. This primarily includes broker commissions, external title and escrow-related fees and transfer taxes and are included in Sales, marketing and operations. (2) Represents holding costs incurred both in the period presented and in prior periods on homes sold in the period presented (“Resale Cohort Holding Costs”). Holding costs include mainly property taxes, insurance, utilities, homeowners association dues and maintenance costs. Holding costs are included in Sales, marketing and operations in the period in which they are incurred (“GAAP Holding Costs”). (3) Advertising expenses are included in Sales, marketing and operations. Other marketing expenses include non-advertising marketing expenses such as acquisition leads and referrals and public relations services and are included in Sales, marketing and operations. (4) Represents operating expenses that are generally related to the volume of homes transacted during the period and tend to be variable in nature. Primarily includes workforce expenses in support of sales, and real estate inventory operations. (5) Represents operating expenses that are not directly correlated with home transaction volumes. These expenses generally include costs related to salaries and benefits for our leadership, finance, technology, human resources, legal, marketing and administrative personnel, as well as third-party professional services fees, rent expense and third-party software. (6) In connection with the appointment of the Company's new Chief Executive Officer in September 2025, the Company granted two make-whole awards related to compensation forfeited from his former employer. The awards consisted of (i) a $15 million cash award and (ii) a restricted stock unit award with a grant date value of $15 million. Both awards vested nine months after his start date and were expensed over the requisite service period. The CEO make-whole provision adjustment reflects only the expense associated with the cash make-whole award. The expense associated with the restricted stock unit make-whole award is included in the stock- based compensation line item presented separately in the reconciliation above. (7) Other segment income (expenses) are primarily made up of depreciation and amortization, gain on deconsolidation, net, restructuring, and amortization of stock-based compensation capitalized to internally developed software. This also includes the elimination of holding costs incurred in prior periods on homes sold in the periods presented, and includes holding costs incurred in the current period on homes remaining in inventory at period end.

Supplemental Macro Charts 3Q26 3Q26 Macro Charts Exhibit 99.3
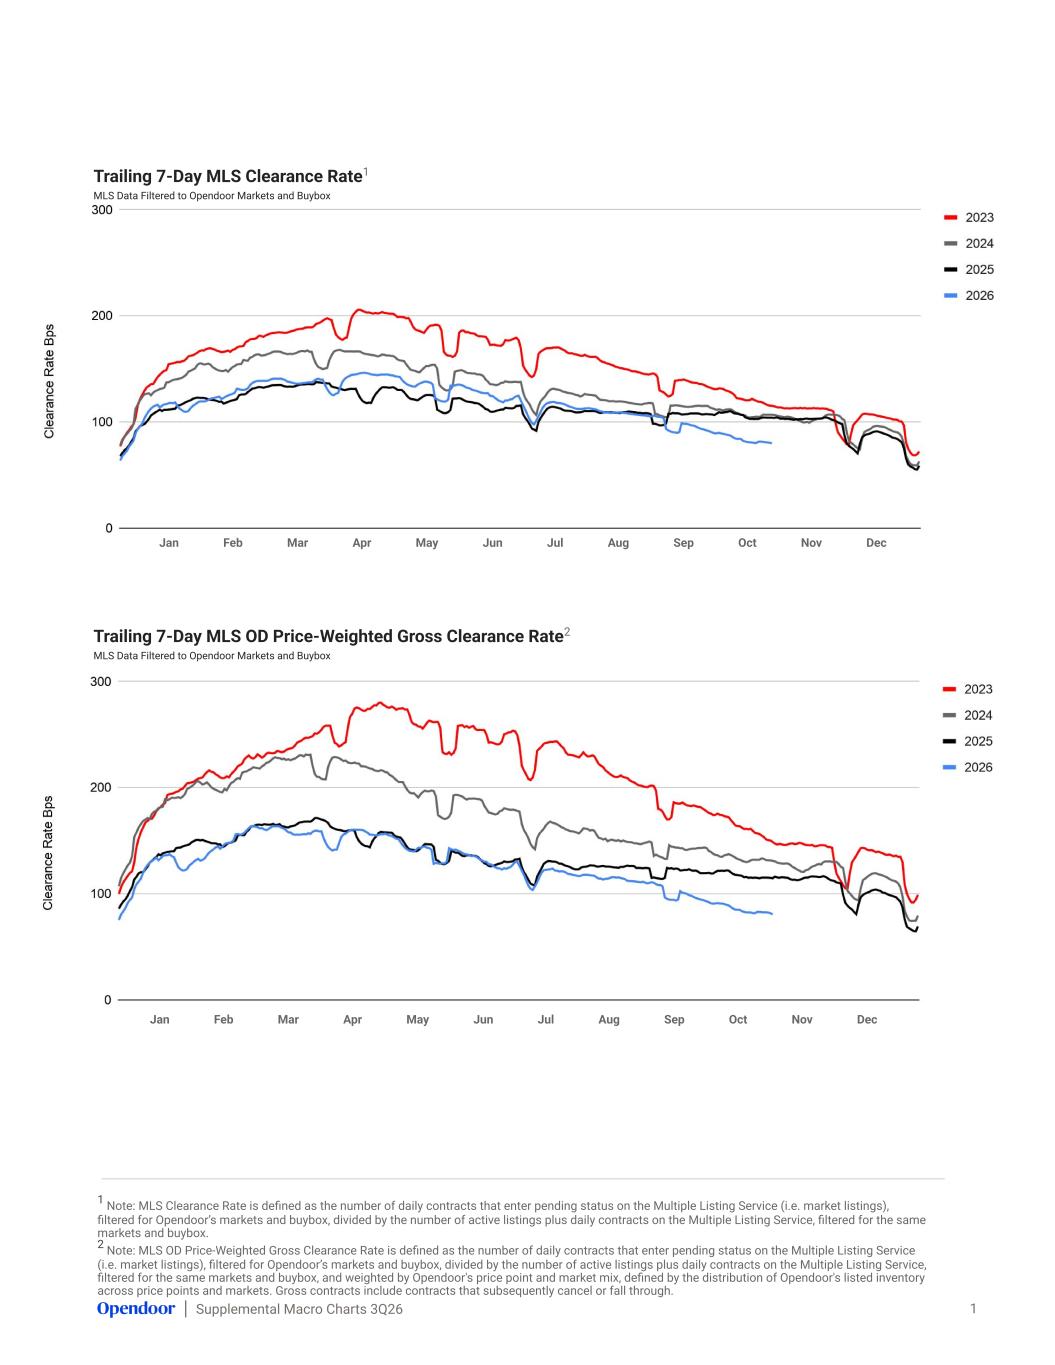
Supplemental Macro Charts 3Q26 Trailing 7-Day MLS Clearance Rate1 MLS Data Filtered to Opendoor Markets and Buybox 1 Trailing 7-Day MLS OD Price-Weighted Gross Clearance Rate2 MLS Data Filtered to Opendoor Markets and Buybox Jan Feb Mar Apr May Jun Jul Aug Sep Oct Nov Dec Jan Feb Mar Apr May Jun Jul Aug Sep Oct Nov Dec 1 Note: MLS Clearance Rate is defined as the number of daily contracts that enter pending status on the Multiple Listing Service (i.e. market listings), filtered for Opendoor’s markets and buybox, divided by the number of active listings plus daily contracts on the Multiple Listing Service, filtered for the same markets and buybox. 2 Note: MLS OD Price-Weighted Gross Clearance Rate is defined as the number of daily contracts that enter pending status on the Multiple Listing Service (i.e. market listings), filtered for Opendoor’s markets and buybox, divided by the number of active listings plus daily contracts on the Multiple Listing Service, filtered for the same markets and buybox, and weighted by Opendoor's price point and market mix, defined by the distribution of Opendoor's listed inventory across price points and markets. Gross contracts include contracts that subsequently cancel or fall through.
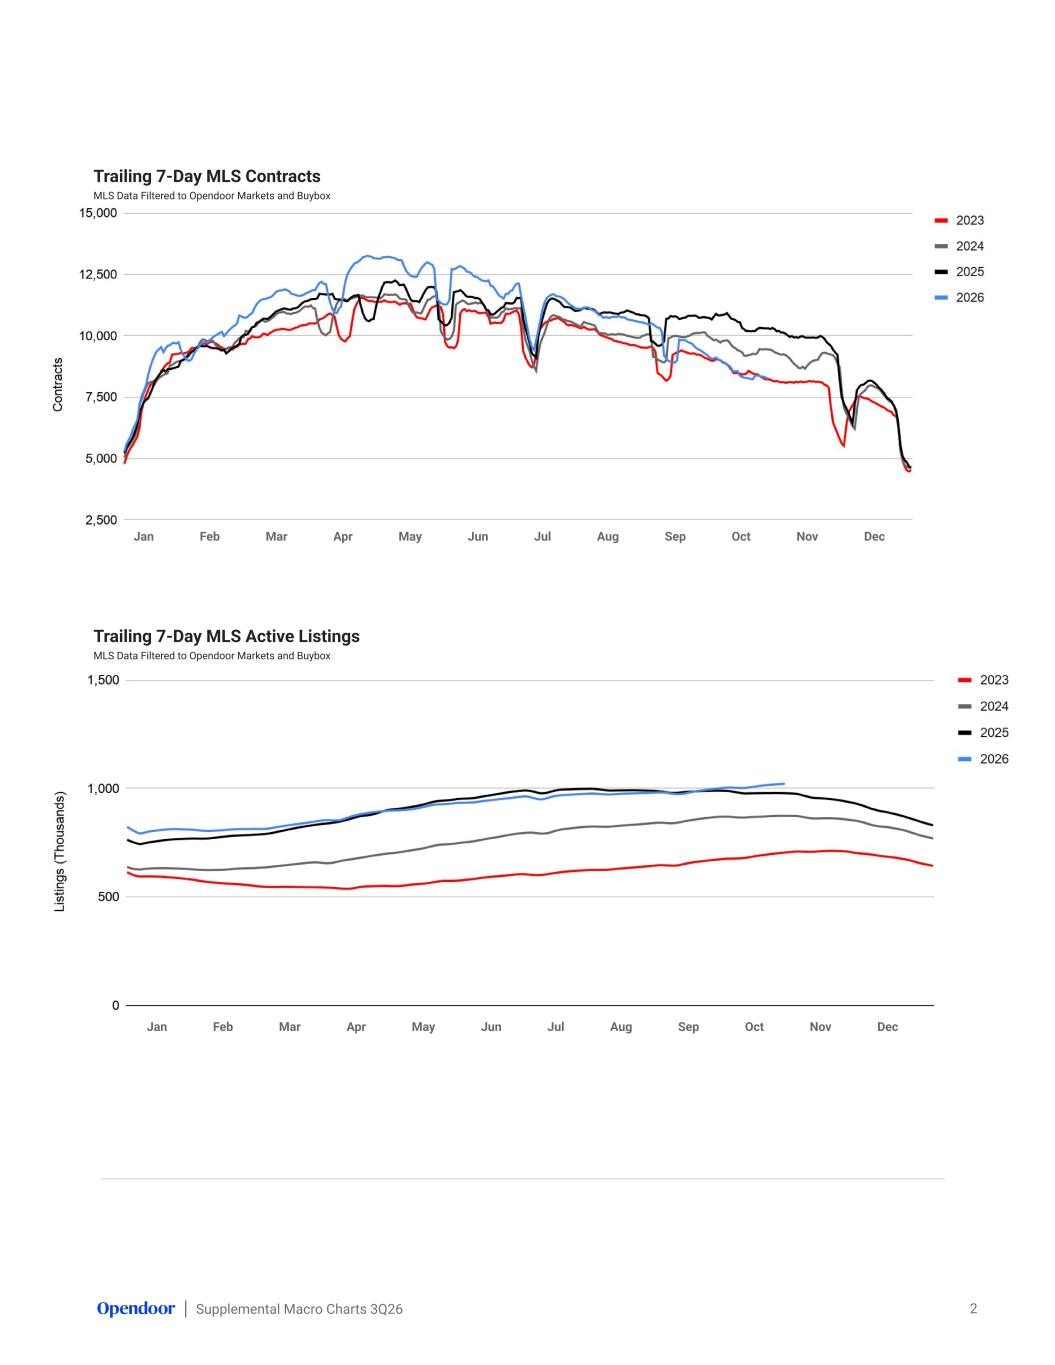
Supplemental Macro Charts 3Q26 Trailing 7-Day MLS Contracts MLS Data Filtered to Opendoor Markets and Buybox 2 Jan Feb Mar Apr May Jun Jul Aug Sep Oct Nov Dec Trailing 7-Day MLS Active Listings MLS Data Filtered to Opendoor Markets and Buybox Jan Feb Mar Apr May Jun Jul Aug Sep Oct Nov Dec
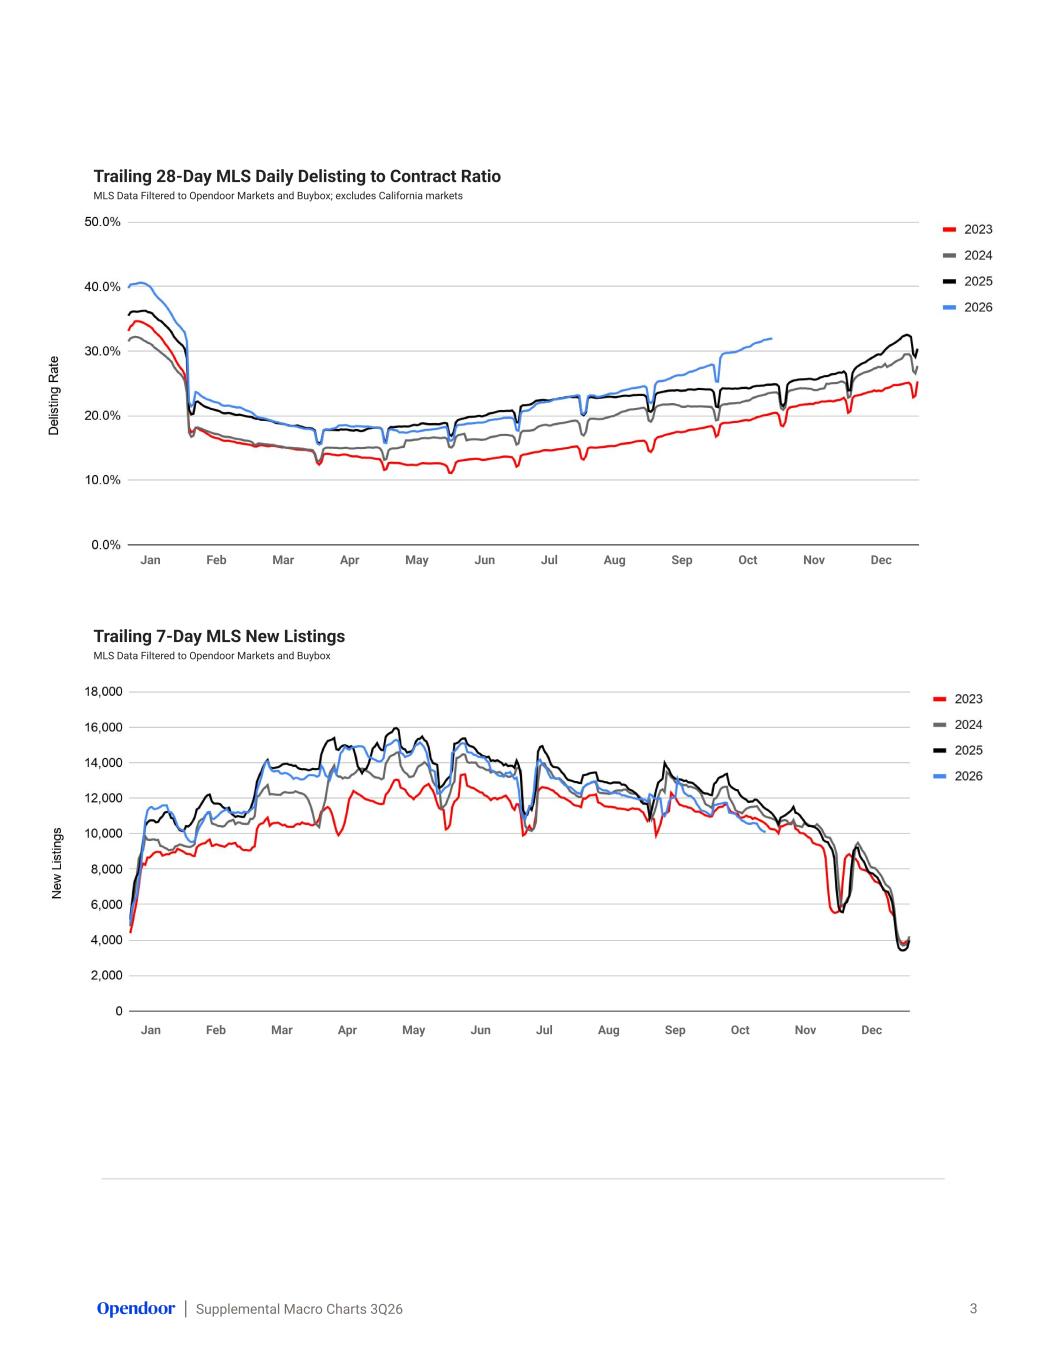
Supplemental Macro Charts 3Q26 Trailing 28-Day MLS Daily Delisting to Contract Ratio MLS Data Filtered to Opendoor Markets and Buybox; excludes California markets 3 Trailing 7-Day MLS New Listings MLS Data Filtered to Opendoor Markets and Buybox Jan Feb Mar Apr May Jun Jul Aug Sep Oct Nov Dec Jan Feb Mar Apr May Jun Jul Aug Sep Oct Nov Dec
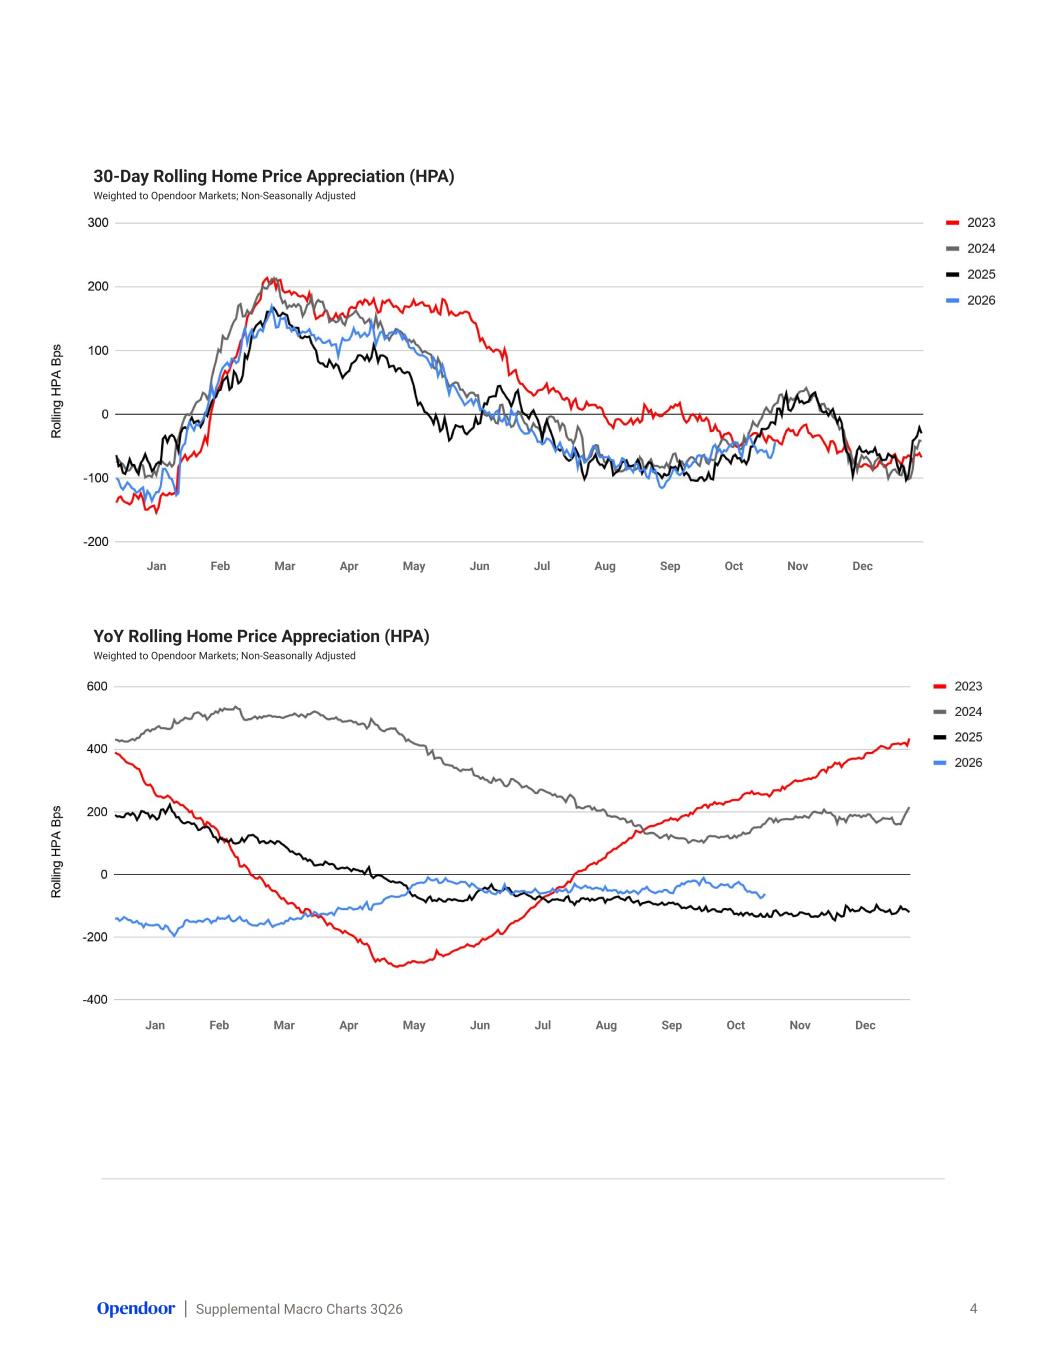
Supplemental Macro Charts 3Q26 30-Day Rolling Home Price Appreciation (HPA) Weighted to Opendoor Markets; Non-Seasonally Adjusted 4 YoY Rolling Home Price Appreciation (HPA) Weighted to Opendoor Markets; Non-Seasonally Adjusted Jan Feb Mar Apr May Jun Jul Aug Sep Oct Nov Dec Jan Feb Mar Apr May Jun Jul Aug Sep Oct Nov Dec
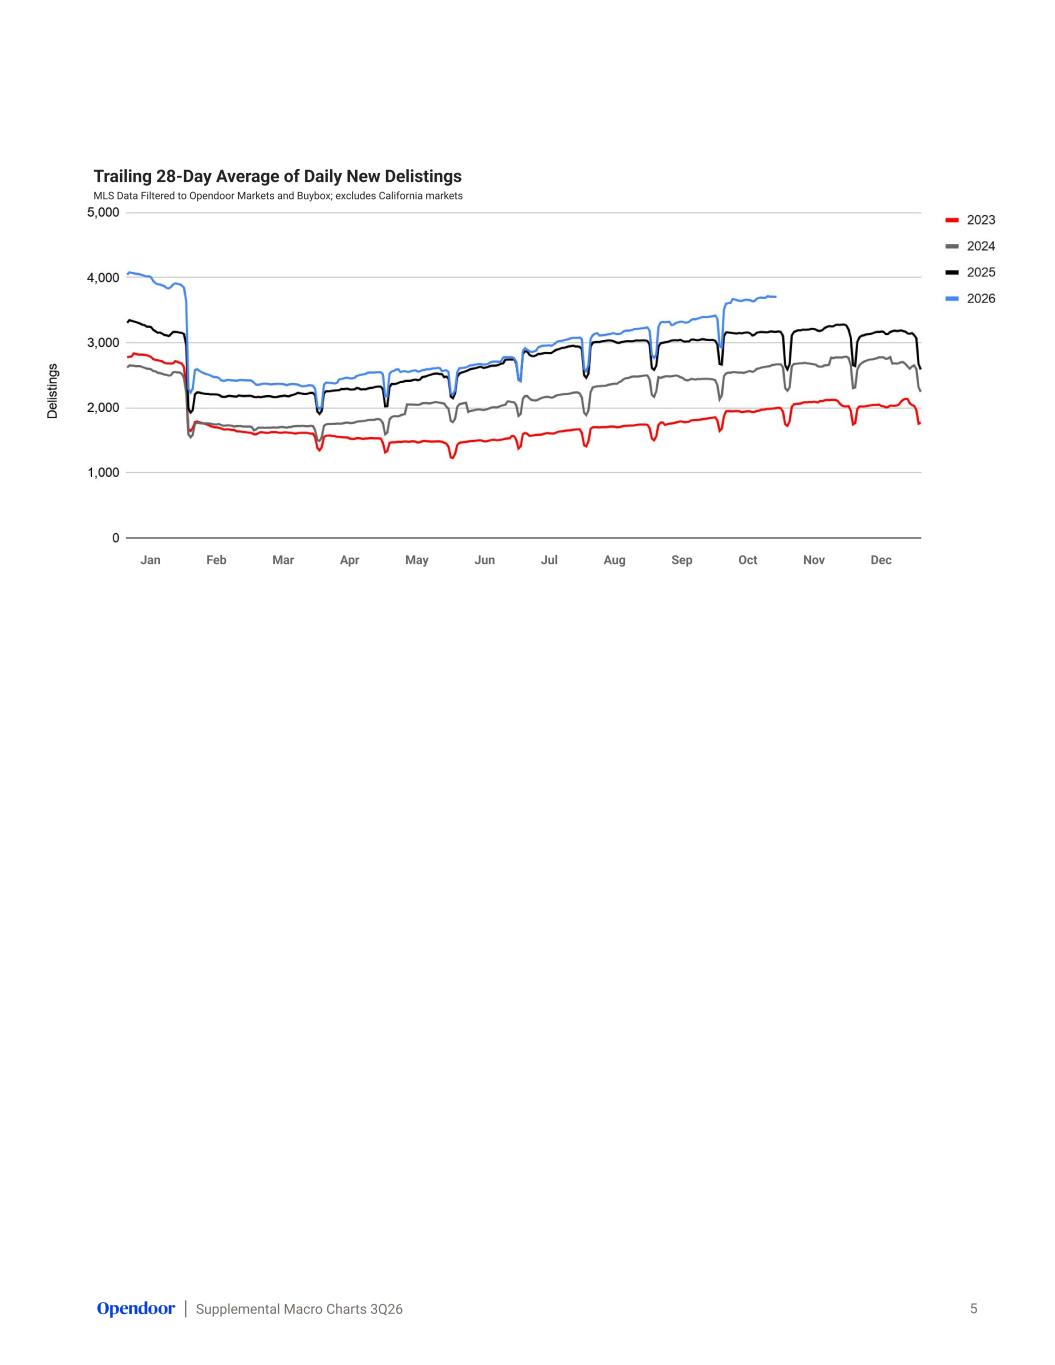
Supplemental Macro Charts 3Q26 Trailing 28-Day Average of Daily New Delistings MLS Data Filtered to Opendoor Markets and Buybox; excludes California markets 5 Jan Feb Mar Apr May Jun Jul Aug Sep Oct Nov Dec